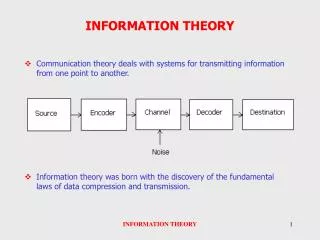
Download
1 / 48
480 likes | 661 Vues
DCM for fMRI : Theory & Practice. Peter Zeidman and Laura Madeley. Overview. Theory Why DCM? What DCM does The State Equation Application Planning DCM studies Hypotheses How to complete in SPM. Brains as Systems. Source: http://public.kitware.com/ImageVote/images/17/.

E N D
DCM for fMRI: Theory & Practice Peter Zeidman and Laura Madeley
Overview • Theory • Why DCM? • What DCM does • The State Equation • Application • Planning DCM studies • Hypotheses • How to complete in SPM
Brains as Systems Source: http://public.kitware.com/ImageVote/images/17/
Brains as Systems Blobs on Brains do not a network make
Taxonomy of Connectivity • Structural connectivity – the physical structure of the brain • Functional connectivity – the likelihood that 2 neuronal populations share associated activity • Effective connectivity – a union between structural and functional connectivity.
The Challenge How to infer causalityespecially with poor temporal resolution?
DCM Overview • Create a neural model to represent our hypothesis • Convolve it with a haemodynamic model to predict real signal from the scanner • Compare models in terms of model fit and complexity
The Neural Model Recipe z4 Z - Regions z2 z3 z1
The Neural Model Recipe z4 Z - Regions A - Average Connections z2 z3 z1
The Neural Model Recipe z4 Attention Z - Regions A - Average Connections B - Modulatory Inputs z2 z3 z1
The Neural Model Recipe z4 Attention Z - Regions A - Average Connections B - Modulatory Inputs C - External Inputs z2 z3 z1
DCM Overview Neural Model Haemodynamic Model 4 x = 2 3 1 e.g. region 2
DCM Overview = Region 2 Timeseries
Dynamical Systems • Less exciting example: interest • My bank gives me 3% interest on savings • How will it grow?
Dynamical Systems The Lorentz Attractor – A Spatial Dynamical System
Dynamical Systems We can represent a network as a matrix From z1 z2 = To z3 z1 z2 z3 (The A-Matrix)
Simplified Network Model z1 z2 z3
Simplified Network Model z1 z1 z2 z2 z3 z3
Simplified Network Model z1 z2 z1 z2 z3 z3
Simplified Network Model { { Modulatory Inputs External Inputs The DCM State Equation
Summary So Far • The Brain is a Dynamical System • The simple DCM “forward model” predicts neural activity • The software (SPM) combines it the haemodynamic model, to predict the fMRItimeseries • We compare models to choose the one best matching the real fMRItimeseries
DCM Motivation Dynamic Causal Modelling (DCM) needed due to a simple problem: • Cognitive neuroscientists want to talk about activation at the level of neuronal systems to hypothesize about cognitive processes • Imaging techniques do not generate data at this level, but give output relating to non-linear correlates e.g. fMRIhaemodynamic response (BOLD signal) • It would be useful to be able to talk about causality in neuronal populations, since we know that signals propagate from some input through a system • DCM attempts to tackle these problems
DCM History • Introduced in 2002 for fMRI data (Friston, 2002) • DCM is a generic approach for inferring hidden (unobserved) neuronal states from measured brain activity. • The mathematical basis and implementation of DCM for fMRI have since been refined and extended repeatedly. • DCMs have also been implemented for a range of measurement techniques other than fMRI, including EEG, MEG (to be presented next week), and LFPs obtained from invasive recordings in humans or animals.
PMd PMd SMA PMv PMv SMA M1 M1 What do we want from fMRI studies? Different Questions re brain function: • Functional specialisation • Where is a stimulus processed? • What are regionally specific effects? • Normal SPM analysis (GLM) 2. Functional integration • How does the system work? • What are inter-regional effects? • How do components of that system interact?
DCM: Basic idea • DCM allows you to model brain activity at the neuronal level (not directly accessible in fMRI) using a bilinear state equation. This takes into account the anatomical architecture of the system and the interactions within that architecture under different conditions of stimulus context • The modelled neuronal dynamics (z) are transformed into area-specific BOLD signals(y) by a hemodynamic forward model (more later) • The aim of DCM is to estimate parameters at the neuronal level so that the modelled BOLD signals are most similar to the experimentally measured BOLD signals
DCM: Methods • Rules of good practice • 10 Simple Rules for DCM (2010). Stephan et al. NeuroImage, 52 • Experimental design • Model Specification • Decision tree • DCM in SPM • Steps within SPM • Example • attention to motion in the visual system (Büchel & Friston 1997, Cereb. Cortex, Büchel et al.1998, Brain) • http://www.fil.ion.ucl.ac.uk/spm/data/
DCM: Rules of good practice • Experimental design • DCM is dependent on experimental perturbations • Experimental conditions enter the model as inputs that either drive the local responses or change connection strengths. • If there is no evidence for an experimental effect (no activation detected by a GLM) → inclusion of this region in a DCM is not meaningful. • Use the same optimization strategies for design and data acquisition that apply to conventional GLM of brain activity: • preferably multi-factorial (e.g. 2 x 2) • one factor that varies the driving (sensory) input (eg static/ moving) • one factor that varies the contextual input (eg attention / no attention)
DCM: Rules of good practice II Defining the model Model selection = determine which model, from a set of plausible alternatives, is most useful i.e., represents the best balance between accuracy and complexity. So.... • define models that are plausible & based on neuroimaging, electrophysiology, TMS, studies • Use anatomical information and computational models to refine DCM • model definition should be as transparent and systematic as possible • How many plausible model alternatives exist? • For small systems it is possible to investigate all possible connectivity architectures. • With increasing number of regions and inputs, evaluating all possible models becomes practically impossible very rapidly. • The map is not the territory..... • Models are caricatures of complex phenomena, enabling testing of underlying mechanisms.
Fig. 1. This schematic summarizes the typical sequence of analysis in DCM, depending on the question of interest. Abbreviations: FFX=fixed effects, RFX=random effects, BMS=Bayesian model selection, BPA=Bayesian parameter averaging, BMA=Bayesian model averaging, ANOVA=analysis of variance. 10 Simple Rules for DCM (2010). Stephan et al. NeuroImage 52.
Attention to motion in the visual system Stimuli 250 radially moving dots at 4.7 degrees/s Pre-Scanning 5 x 30s trials with 5 speed changes (reducing to 1%) Task - detect change in radial velocity Scanning(no speed changes) 6 normal subjects, 4 x 100 scan sessions; each session comprising 10 scans of 4 different conditions F A F N F A F N S ................. F - fixation point only A - motion stimuli with attention (detect changes) N - motion stimuli without attention S - no motion PPC V3A V5+ Attention – No attention Büchel & Friston 1997, Cereb. Cortex Büchel et al.1998, Brain
Practical steps of a DCM study - I Photic Model 2:attentional modulationof V1→V5 • Definition of the model • Structure: which areas, • connections and inputs? • Which parameters represent • my hypothesis? • What are the alternative • models to test? • Defining criteria for inference: • single-subject analysis: stat. threshold? contrast? • group analysis: which 2nd-level model? • Conventional SPM analysis (subject-specific) • DCMs fitted separately for each session → consider concatenation of sessions or adequate 2nd level analysis PPC 0.85 0.70 0.84 1.36 V1 -0.02 0.57 V5 Motion 0.23 Attention
Practical steps of a DCM study - II • Extraction of time series, e.g. via VOI tool in SPM • n.b anatomical & functional standardisation important for group analyses • Possible definition of a new design matrix, if the “normal” design matrix does not represent the inputs appropriately. • DCM only reads timing information of each input from the design matrix, no parameter estimation necessary • Definition of model • via DCM-GUI or directlyin MATLAB
Practical steps of a DCM study - III • DCM parameter estimation • Remember models with many regions & scans can crash MATLAB! • Model comparison and selection: • Which of all models considered is the optimal one? Bayesian model selection tool • Testing the hypothesisStatistical test onthe relevant parametersof the optimal model
static moving No attent Attent. Specify design matrix & SPM analysis Experimental design DCM analysis regressors • -Vision (photic) • -motion • -attention • Sensory input factor Photic Motion Attention Contextual factor No motion/ no attention Motion / no attention Motion / attention No motion/ attention Normal SPM regressors
Extraction of time series (VOIs definition) 1.DCM for a single subject analysis (i.e. no 2nd-level analysis intended): determine representative co-ordinates for each brain region from the appropriate contrast (e.g. V1 from “photic” contrast ) • Subject specific DCM, but results will eventually be entered into a 2nd-level analysis: determine group maximum for the area of interest (e.g. from RFX analysis) in the appropriate contrast in each subject, jump to local maximum nearest to the group maximum, using the same contrast and a liberal threshold (p<0.05, uncorrected)
VOIs definition: V5 Contrast Name Co-ordinates
Definition of DCM name DCM button In order! In Order!! In Order!!
Output Average connectivity (A)
Motion Attention Modulation of connections (B) Photic Motion Attention
PPC V1 V5 Comparison of two simple models Photic Model 1:attentional modulationof PPC→V5 Model 2:attentional modulationof V1→V5 PPC 0.85 0.70 0.84 1.36 V1 Photic Attention -0.02 0.57 0.55 V5 0.86 0.75 Motion 0.23 1.42 0.89 Attention 0.56 -0.02 Motion
Models comparison and selection Model 2 better than model 1
SPM: Issues What you cannot do with BMS • A DCM is defined for a specific data set. Therefore BMS cannot be applied to models that are fitted to different data • Cannot compare models with different numbers of regions, because changing the regions changes the data • Maximum of 8 regions with SPM8 • Designed for sensory-driven studies
So, DCM…. • enables one to infer hidden neuronal processes from fMRI data • tries to model the same phenomena as a GLM • explaining experimentally controlled variancein local responses • based on connectivity and its modulation • allows one to test mechanistic hypotheses about observed effects • is informed by anatomical and physiological principles. • uses a Bayesian framework to estimate model parameters • is a generic approach to modelling experimentally perturbed dynamic systems. • provides an observation model for neuroimaging data, e.g. fMRI, M/EEG • Should be planned for early in the experimental process
References • The first DCM paper: Dynamic Causal Modelling (2003). Friston et al.NeuroImage 19:1273-1302. • Physiological validation of DCM for fMRI: Identifying neural drivers with functional MRI: an electrophysiological validation (2008). David et al. PLoS Biol. 6 2683–2697 • Hemodynamic model: Comparing hemodynamic models with DCM (2007). Stephan et al. NeuroImage 38:387-401 • Nonlinear DCMs:Nonlinear Dynamic Causal Models for FMRI (2008). Stephan et al. NeuroImage 42:649-662 • Two-state model: Dynamic causal modelling for fMRI: A two-state model (2008). Marreiros et al. NeuroImage 39:269-278 • Group Bayesian model comparison: Bayesian model selection for group studies (2009). Stephan et al. NeuroImage 46:1004-10174 • 10 Simple Rules for DCM (2010). Stephan et al. NeuroImage 52. • Dynamic Causal Modelling: a critical review of the biophysical and statistical foundations. Daunizeauet al. Neuroimage(2010), in press • SPM Manual, SMP coursesslides, lastyearspresentations.
2 1 3 2 1 3