Download
1 / 2
20 likes | 99 Vues
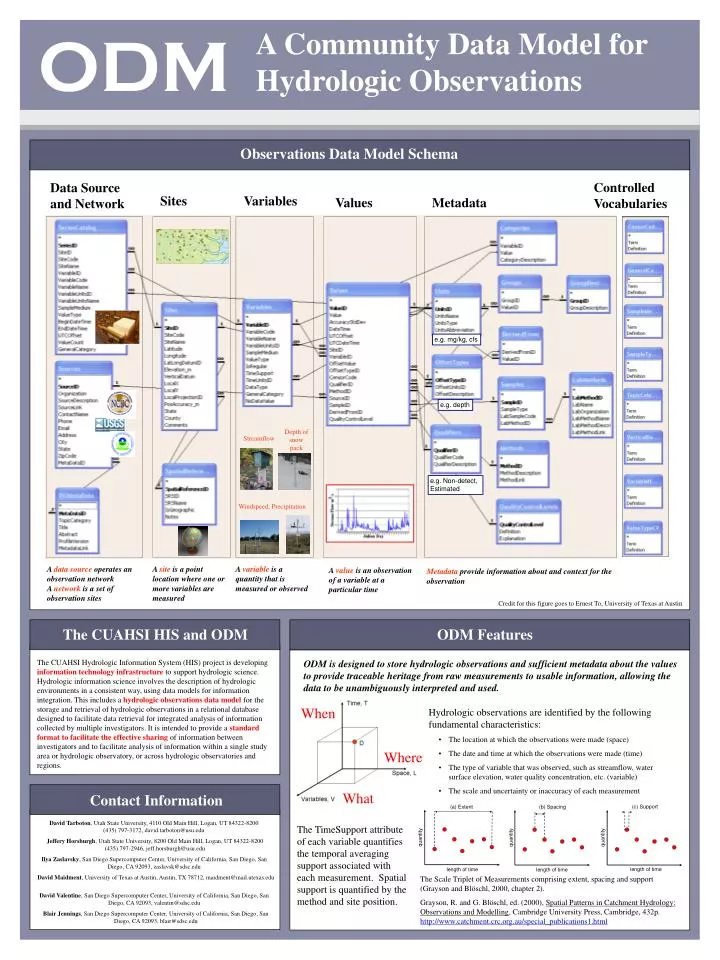
ODM. A Community Data Model for Hydrologic Observations. Observations Data Model Schema. Controlled Vocabularies. Data Source and Network. Sites. Variables. Values. Metadata. e.g. mg/kg, cfs. e.g. depth. Depth of snow pack. Streamflow. e.g. Non-detect, Estimated.

E N D
ODM A Community Data Model for Hydrologic Observations Observations Data Model Schema Controlled Vocabularies Data Source and Network Sites Variables Values Metadata e.g. mg/kg, cfs e.g. depth Depth of snow pack Streamflow e.g. Non-detect, Estimated Windspeed, Precipitation A data source operates an observation network A network is a set of observation sites A site is a point location where one or more variables are measured A variable is a quantity that is measured or observed A value is an observation of a variable at a particular time Metadata provide information about and context for the observation Credit for this figure goes to Ernest To, University of Texas at Austin The CUAHSI HIS and ODM ODM Features The CUAHSI Hydrologic Information System (HIS) project is developing information technology infrastructure to support hydrologic science. Hydrologic information science involves the description of hydrologic environments in a consistent way, using data models for information integration. This includes a hydrologic observations data model for the storage and retrieval of hydrologic observations in a relational database designed to facilitate data retrieval for integrated analysis of information collected by multiple investigators. It is intended to provide a standard format to facilitate the effective sharing of information between investigators and to facilitate analysis of information within a single study area or hydrologic observatory, or across hydrologic observatories and regions. ODM is designed to store hydrologic observations and sufficient metadata about the values to provide traceable heritage from raw measurements to usable information, allowing the data to be unambiguously interpreted and used. When • Hydrologic observations are identified by the following fundamental characteristics: • The location at which the observations were made (space) • The date and time at which the observations were made (time) • The type of variable that was observed, such as streamflow, water surface elevation, water quality concentration, etc. (variable) • The scale and uncertainty or inaccuracy of each measurement Where What Contact Information David Tarboton, Utah State University, 4110 Old Main Hill, Logan, UT 84322-8200 (435) 797-3172, david.tarboton@usu.edu The TimeSupport attribute of each variable quantifies the temporal averaging support associated with each measurement. Spatial support is quantified by the method and site position. Jeffery Horsburgh, Utah State University, 8200 Old Main Hill, Logan, UT 84322-8200 (435) 797-2946, jeff.horsburgh@usu.edu Ilya Zaslavsky, San Diego Supercomputer Center, University of California, San Diego, San Diego, CA 92093, zaslavsk@sdsc.edu David Maidment, University of Texas at Austin, Austin, TX 78712, maidment@mail.utexas.edu The Scale Triplet of Measurements comprising extent, spacing and support (Grayson and Blöschl, 2000, chapter 2). Grayson, R. and G. Blöschl, ed. (2000), Spatial Patterns in Catchment Hydrology: Observations and Modelling, Cambridge University Press, Cambridge, 432p.http://www.catchment.crc.org.au/special_publications1.html David Valentine, San Diego Supercomputer Center, University of California, San Diego, San Diego, CA 92093, valentin@sdsc.edu Blair Jennings, San Diego Supercomputer Center, University of California, San Diego, San Diego, CA 92093, blair@sdsc.edu
This work is funded by the National Science Foundation ODM Examples Data Processing Applications Base Station Computer(s) Observations Database (ODM) Telemetry Network Internet Sensors ODM Features Methods and Samples Variable Attributes Data Types Offset • Continuous (Frequent sampling - fine spacing) • Instantaneous (Spot sampling - coarse spacing) • Cumulative • Incremental • Average • Maximum • Minimum • Constant over Interval • Categorical OffsetValue Distance from a datum or control point at which an observation was made OffsetType defines the type of offset, e.g. distance below water level, distance above ground surface, or distance from bank of river Method specifies the method whereby an observation is measured, e.g. Streamflow using a V notch weir, TDS using a Hydrolab, sample collected in auto-sampler SampleID is used for observations based on the laboratory analysis of a physical sample and identifies the sample from which the observation was derived. This keys to a unique LabSampleID (e.g. bottle number) and name and description of the analytical method used by a processing lab. VariableName, e.g. discharge VariableCode, e.g. 0060 SampleMedium, e.g. water Valuetype, e.g. field observation, laboratory sample IsRegular, e.g. Yes for regular or No for intermittent TimeSupport (averaging interval for observation) DataType, e.g. Continuous, Instantaneous, Categorical GeneralCategory, e.g. Climate, Water Quality NoDataValue, e.g. -9999 Groups and Derived From Associations Data Quality Observation Series Accuracy and Precision ObsAccuracyStdDev Numeric value that expresses measurement accuracy as the standard deviation of the error associated with each specific observation Qualifier Code and Description provides qualifying information about the observations, e.g. Estimated, Provisional, Derived, Holding time for analysis exceeded QualityControlLevel records the level of quality control that the data has been subjected to.- Level 0. Raw Data - Level 1. Quality Controlled Data - Level 2. Derived Products - Level 3. Interpreted Products - Level 4. Knowledge Products Stage and Streamflow Example Daily Average Discharge ExampleDaily Average Discharge Derived from 15 Minute Discharge Data Water Chemistry From a Profile in a Lake ODM Utilities Sensor to Database Capability Data Distribution Via CUAHSI HIS Web Services ODM Software Tools • Load – import existing data directly to ODM • Query and export – export data series and metadata • Visualize – plot and summarize data series • Edit – delete, modify, adjust, interpolate, average, etc. • Machine to machine communication of data over the internet • Users can program against the database as if it were on their local machine Automated tools for ingesting sensor data into the ODM Open Comment Period See http://www.cuahsi.org/his/documentation.html for the detailed design specification document. Comments on this design are welcome. The open comment period ends January 31, 2007. Send comments to dtarb@cc.usu.edu.