Download
1 / 13
150 likes | 307 Vues
Propagation Trends 2014-2015. Solar Maximum! But the slow decline to solar minimum in 2020 is likely to begin later this year. 400 Years of Sunspot Observations 55 years of unusually high sunspot activity (1947 - 2002) ended with the decline of Solar Cycle 23. Dalton Minimum 30 years

E N D
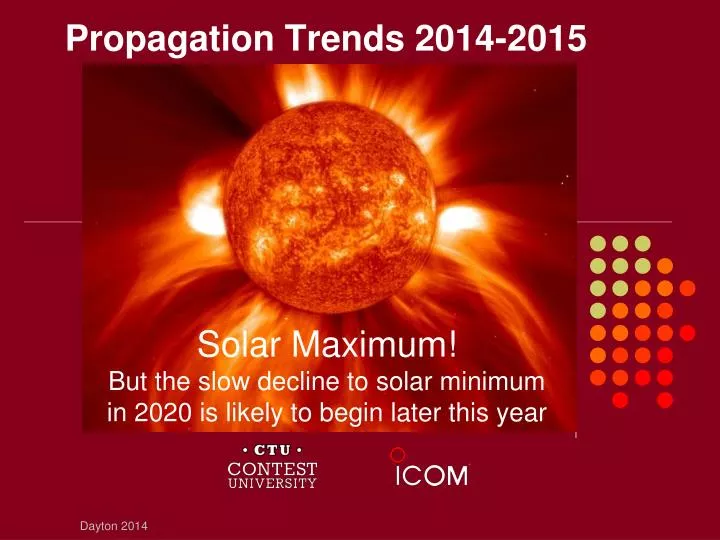
Propagation Trends 2014-2015 Solar Maximum!But the slow decline to solar minimum in 2020 is likely to begin later this year Dayton 2014
400 Years of Sunspot Observations55 years of unusually high sunspot activity(1947 - 2002) ended with the decline of Solar Cycle 23 Dalton Minimum 30 years 1790-1820 Early 20th century minimum 20 years 1896-1916 Modern Maximum 1947-2002 Maunder Minimum 70 years 1645-1715 The 80 year Gleissberg cycle is clearly visible in this data
Solar Cycle 24compared to all solar cycles since 1944 Cycle 24 The lowest solar minimum in 100 years The weakest solar cycle maximum in 100 years Dayton 2013
Solar Cycle 24 Progressthe ongoing second peak is stronger than expected Nov 2011 1st peak Feb 2014 2nd peak 2002 end of the Modern Maximum Sunspot Number 2020 solar minimum 2008 266 spotless days http://solarscience.msfc.nasa.gov/images/ssn_predict_l.gif
Solar Cycle 24 compared to similar Solar Cycle 14 two years between Solar Cycle 14 peaks Ongoing Solar Cycle 24 is also double peaked Dayton 2013
Why are there often two solar cycle peaks? Sunspot Number The northern and southern solar hemisphere solar cycle peaks never occur at the same time Dayton 2013
Solar Cycle 24 is similar to Cycle 14the solar southern hemisphere sunspot peak occurred two years after the northern hemisphere sunspot peak two years between Solar Cycle 14 peaks Sunspot Groups per Month N S Southern hemisphere sunspots started to increase one year after the northern hemisphere sunspot peak Dayton 2013
The Last Two Solar Cycles also had Double Peaksbut much higher than Solar Cycle 24 two years between solar cycle peaks two years between solar cycle peaks N S N S southern hemisphere sunspots started to increase one year after the northern hemisphere sunspot peak Dayton 2013
Solar North-South Polar Field Reversalsolar maximum usually occurs afterboth polar fields have reversed polarity south polar field reversed polarity in June 2013 north polar field reversed polarity in June 2012 field reversal N smoothed polar field strength micro-Tesla S north polar field strength remains very weak Dec Jun 2012 2013 Dec Both poles had reversed polarity by June 2013 Dayton 2013
Sunspot Activity in each Solar Hemisphere Solar Cycle 24 achieved its second peak from Oct 2013 through Feb 2014 Northern hemisphere sunspot activity further decreased after Jun 2013 Southern hemisphere sunspot activity peaked from Oct 2013 - Feb 2014 ? Southern Sunspot Number Northern ? 2014 Jan Jul 2012 Jan 2013 Southern hemisphere sunspot activity is now significantly greater than northern hemisphere activity Dayton 2013
Weak Solar Cycle 24 has been unusually favorable for 160 and 80 MetersThe A-index has been much lower than prior sunspot cycles the A index usually increases during the two years after solar maximum Solar Cycle 23 double peaks unusually low A index The A-Index mayincrease moderately for the next two years Dayton 2013
A Long Range Estimate of Solar Cycle 25could sunspots nearly disappear by 2025? Modern Maximum 1947 - 2002 19 http://myweb.wwu.edu/dbunny/pdfs/Solar-Cycle-25-Amplitude-estimate.pdf 21 n MM 22 3 18 8 11 4 n MM 9 17 2 1790 - 1835 20 15 10 1 13 16 12 7 14 ? 5 6 some solar scientists expect Cycle 25 to be theweakest solar cycle (SSN=7) in more than 300 years http://www.landscheidt.info/?q=node/280
Solar Cycle 24 Prediction the slow decline to solar minimum in 2020 is likely to begin later this year 2020 Minimum 2015 Prediction Sunspot Number http://solarscience.msfc.nasa.gov/images/ssn_predict_l.gif