Download
1 / 7
70 likes | 222 Vues
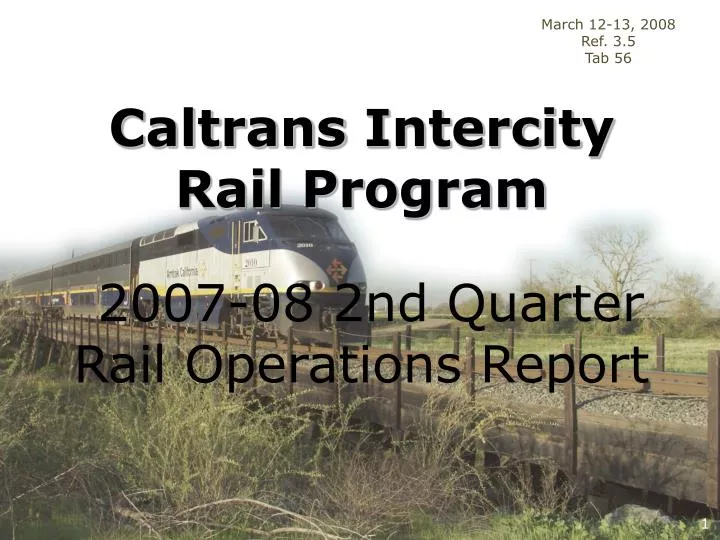
March 12-13, 2008 Ref. 3.5 Tab 56. Caltrans Intercity Rail Program 2007-08 2nd Quarter Rail Operations Report. 1. Ridership reported is actual results. Financial data includes estimates for December. Combined Ridership was up 7.1% over prior year’s 2nd quarter.

E N D
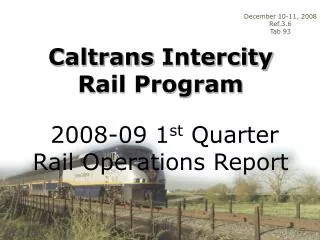
March 12-13, 2008 Ref. 3.5 Tab 56 CaltransIntercity Rail Program 2007-08 2nd Quarter Rail Operations Report 1
Ridership reported is actual results. Financial data includes estimates for December. Combined Ridership was up 7.1% over prior year’s 2nd quarter. Revenues climbed 7.2% while expenses increased 1.9% compared to last year. Farebox ratio was 53.5%--2.7 percentage points above last year. On-time performance was 83.2%--8.8 percentage points higher than last year. STATEWIDE OVERVIEW—2ndQuarter 2
STATEWIDE OVERVIEW—2nd Quarter Performance Indicators 3
Ridership was up 4.6% over prior year’s 2nd quarter. Monthly ridership records have been set in 9 of the last 12 months. Revenues climbed 4.3%, expenses declined 2.4% compared to the prior year. Farebox ratio climbed to 60.7%-- 3.9 percentage points above last year. On-time performance was 80.5%-- 4.5 percentage points above last year. Pacific Surfliner Route—2nd Quarter 4
Ridership up 7.1% compared to prior year’s 2nd quarter. Revenues increased 6.7% and expenses also increased 3.7% compared to the prior year. Farebox ratio increased to 50.6%--1.5 percentage points above last year’s 49.1% ratio. On-time performance was 84.5%--an 8.3 percentage point improvement over last year. San Joaquin Route—2nd Quarter 5
Ridership continues strong growing 11.5% compared to prior year’s 2nd quarter as a continuing result of the increased frequencies. Revenues climbed 15.2% while expenses increased 7.7% compared to the prior year. Farebox ratio improved to 44.9%-- 2.9 percentage points above last year. On-time performance was 84.9%-- 12.6 percentage points better than last year. Best results in the last 10 quarters. Capitol Corridor—2nd Quarter 6