Download
1 / 52
600 likes | 952 Vues
Introduction to Genetic Epidemiology. HGEN619, 2006 Hermine H. Maes. Genetic Epidemiology. Establishing / Quantifying the role of genes and environment in variation in disease and complex traits ~ Answering questions about the importance of nature and nurture on individual differences

E N D
Introduction to Genetic Epidemiology HGEN619, 2006 Hermine H. Maes
Genetic Epidemiology • Establishing / Quantifying the role of genes and environment in variation in disease and complex traits ~ Answering questions about the importance of nature and nurture on individual differences • Finding those genes and environmental factors
Genes & Environment • How much of the variation in a trait is accounted for by genetic factors? • Do shared environmental factors contribute significantly to the trait variation? • The first of these questions addresses heritability, defined as the proportion of the total variance explained by genetic factors
Nature-nurture question • Sir Francis Galton: comparing the similarity of identical and fraternal twins yields information about the relative importance of heredity vs environment on individual differences • Gregor Mendel: classical experiments demonstrated that the inheritance of model traits in carefully bred material agreed with a simple theory of particulate inheritance • Ronald Fisher: first coherent account of how the ‘correlations between relatives’ explained ‘on the supposition of Mendelian inheritance’
1 Gene 3 Genotypes 3 Phenotypes 2 Genes 9 Genotypes 5 Phenotypes 3 Genes 27 Genotypes 7 Phenotypes 4 Genes 81 Genotypes 9 Phenotypes Polygenic Traits
Individual differences • Physical attributes (height, eye color) • Disease susceptibility (asthma, anxiety) • Behavior (intelligence, personality) • Life outcomes (income, children)
Polygenic Model • Polygenic model: variation for a trait caused by a large number of individual genes, each inherited in a strict conformity to Mendel’s laws • Multifactorial model: many genes and many environmental factors also of small and equal effect • Effects of many small factors combined > normal (Gaussian) distribution of trait values, according to the central limit theorem.
Central Limit Theorem • The normal distribution is to be expected whenever variation is produced by the addition of a large number of effects, non-predominant • This holds quite often • Quantitative traits
Continuous or Categorical ? • Body Mass Index vs “obesity” • Blood pressure vs “hypertensive” • Bone Mineral Density vs “fracture” • Bronchial reactivity vs “asthma” • Neuroticism vs “anxious/depressed” • Reading ability vs “dyslexic” • Aggressive behavior vs “delinquent”
Multifactorial Threshold Model of Disease Single threshold Multiple thresholds unaffected affected normal mild mod severe Diseaseliability Disease liability
Genetically Complex Diseases • Imprecise phenotype • Phenocopies / sporadic cases • Low penetrance • Locus heterogeneity/ polygenic effects
Complex Trait Model Linkage Marker Gene1 Linkage disequilibrium Mode of inheritance Linkage Association Gene2 Disease Phenotype Individual environment Gene3 Common environment Polygenic background
Causes of Variation • pre-1990 • estimation of ‘anonymous’ genetic and environmental components of phenotypic variation • genetic epidemiologic studies • post-1990 • identification of QTL’s: quantitative trait loci contributing to genetic variation of complex (quantitative) traits • linkage and association studies
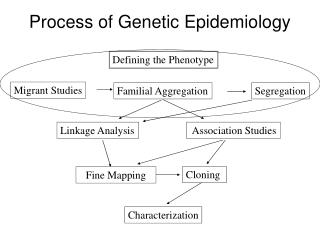
Stages of Genetic Mapping • Are there genes influencing this trait? • Genetic epidemiological studies • Where are those genes? • Linkage analysis • What are those genes? • Association analysis
Partitioning Variation • phenotypic variance (VP) partitioned in genetic (VG) and environmental (VE) • VP = VG + VE • Assumptions: additivity & independence of genetic and environmental effects • heritability (h2): proportion of variance due to genetic influences (h2 = VG /VP) • property of a group (not an individual), thus specific to a group in place & time
Sources of Variance • Genetic factors: • Additive (A) • Dominance (D) • Environmental factors: • Common / Shared (C) • Specific / Unique (E) • Measurement Error, confounded with E
Genetic Factors • Additive genetic factors (A): sum of all the effects of individual loci • Non-additive genetic factors: result of interactions between alleles at the same locus (dominance, D) or between alleles on different loci (epistasis)
Environmental Factors • Shared [common or between-family] environmental factors (C): aspects of the environment shared by members of same family or people who live together, and contribute to similarity between relatives • Non-shared [specific, unique or within-family] environmental factors (E): unique to an individual, contribute to variation within family members, but not to their covariation
Estimating Components • Estimate phenotypic variance components from data on covariances of related individuals • Different types of relative pairs share different amounts of phenotypic variance • Biometrical genetics theory: specify amounts in terms of genetic and environmental variances • Three major types of study: family, adoption and twin
Designs to disentangle G+E • Resemblance between relatives caused by: • Shared Genes (G = A + D) • Environment Common to family members (C) • Differences between relatives caused by: • Non-shared Genes • Unique environment (E)
Informative Designs • Family studies – G + C confounded • MZ twins alone – G + C confounded • MZ twins reared apart – rare, atypical, selective placement ? • Adoption studies – increasingly rare, atypical, selective placement ? • MZ and DZ twins reared together • Extended twin design
Classical Twin Study • MZ and DZ twins reared together • MZ twins genetically identical • DZ twins share on average half their genes • Equal Environments Assumption • MZ and DZ twins share relevant environmental influences to same extent
Zygosity Identity at marker loci - except for rare mutation MZ and DZ twins: determining zygosity using ABI Profiler™ genotyping (9 STR markers + sex) MZ DZ DZ
MZ & DZ Correlations • rMZ > rDZ: G (heritability) • C: increase rMZ & rDZ • Relative magnitude of the MZ and DZ correlations > contribution of additive genetic (G) and shared environmental (C) factors • 1-rMZ: importance of specific environmental (E) factors
Example • thus if, VP = VA + VC + VE = 2.0 CovMZ = VA + VC = 1.6 CovDZ = 1/2VA + VC = 1.2 • then, by algebra, VA = 0.8, VC = 0.8, VE = 0.4 • but it isn’t always so simple, consider VP = 1.0, CovMZ = 0.6; CovDZ = 0.65 • then VA = -0.1, VC = 0.7, VE = 0.4 • nonsensical negative variance component
Observed Statistics • Trait variance & MZ and DZ covariance as unique observed statistics • Estimate the contributions of additive genes (A), shared (C ) and specific (E) environmental factors, according to the genetic model • Useful tool to generate the expectations for the variances and covariances under a model is path analysis
Path Analysis • Allows us to diagrammatically represent linear models for the relationships between variables • Easy to derive expectations for the variances and covariances of variables in terms of the parameters of the proposed linear model • Permits translation into matrix formulation
C D E A Variance ComponentsP = eE + aA + cC + dD Additive Genetic Dominance Genetic Unique Environment Shared Environment c a e d Phenotype
ACE Model Path Diagram for MZ & DZ Twins 1 MZ=1.0 / DZ=0.5 E C A A C E e c a a c e PT1 PT2
Model Fitting • Evaluate significance of variance components - effect size & sample size • Evaluate goodness-of-fit of model - closeness of observed & expected values • Compare fit under alternative models • Obtain maximum likelihood estimates
Mx • Structural equation modeling package • Software: www.vcu.edu/mx • Manual: Neale et al. 2006 • Free
Both continuous and categorical variables Systematic approach to hypothesis testing Tests of significance Can be extended to: More complex questions Multiple variables Other relatives Structural equation modeling
SEM: more complex questions I • Are the same genes acting in males and females? (sex limitation) • Role of age on (a) mean (b) variance (c) variance components • Are G & E equally important in age, country cohorts? (heterogeneity) • Are G & E same in other strata (e.g. married/unmarried)? ( G x E interaction)
SEM: more complex questions II • Do the same genes account for variation in multiple phenotypes? (multivariate analysis) • Do the same genes account for variation in phenotypes measured at different ages? (longitudinal analysis) • Do specific genes account for variation/covariation in phenotypes? (linkage/association)
Stages of Genetic Mapping • Are there genes influencing this trait? • Epidemiological studies • Where are those genes? • Linkage analysis • What are those genes? • Association analysis
Linkage Analysis • Sharing between relatives • Identifies large regions • Include several candidates • Complex disease • Scans on sets of small families popular • No strong assumptions about disease alleles • Low power • Limited resolution
Stages of Genetic Mapping • Are there genes influencing this trait? • Epidemiological studies • Where are those genes? • Linkage analysis • What are those genes? • Association analysis
Association Analysis • Sharing between unrelated individuals • Trait alleles originate in common ancestor • High resolution • Recombination since common ancestor • Large number of independent tests • Powerful if assumptions are met • Same disease haplotype shared by many patients • Sensitive to population structure