Download
1 / 23
240 likes | 388 Vues
GENETIC EPIDEMIOLOGY. Institute of Clinical Medicine Po-Hsiu Kuo – 04/16/2008. Outline. Overview of gene mapping Allele frequency Quantitative genetics Genetic component and Heritability Hardy-Weinberg Equilibrium Linkage Disequilibrium. Gene mapping.

E N D
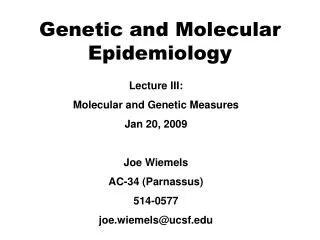
GENETIC EPIDEMIOLOGY Institute of Clinical Medicine Po-Hsiu Kuo – 04/16/2008
Outline • Overview of gene mapping • Allele frequency • Quantitative genetics • Genetic component and Heritability • Hardy-Weinberg Equilibrium • Linkage Disequilibrium
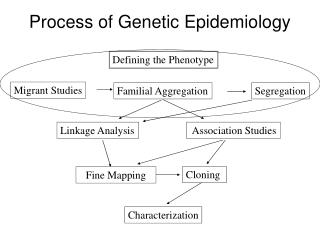
Gene mapping LOCALIZE and then IDENTIFYalocus that regulates a trait Association analysis Linkage analysis
Allele frequency and genotype frequency • Allele (gene) • Genotype frequency? 0.3, 0.6, 0.1 • Allele frequency f(A1) ? 120/200 = 0.6 • Allele frequency f(A2) ? 80/200 = 0.4
Factors influence on allele frequency • Population size • Reproduce rate and Survival rate • Immigration and mutation • Pattern of assortative mating
Quantitative genetics • Study of continuous traits (such as height or weight) and its underlying mechanisms • Combined effect of the many underlying genes results in a continuous distribution of phenotypic values • Quantitative genetics is not limited to continuous traits, but to all traits that are determined by many genes • Continuous traits are quantitative traits with a continuous phenotypic range. They are usually polygenic, and may also have a significant environmental influence • Traits with ordinal numbers, such as number of bristles on a fruit fly. These traits can be either treated as approximately continuous traits or as threshold traits • Some qualitative traits can be treated as if they have an underlying quantitative basis, expressed as a threshold trait (or multiple thresholds)
Population level Genotype frequencies (Random mating) Allele 1 A(p) a(q) A(p) AA(p2) Aa(pq) Allele 2 a(q) aa(q2) aA(qp) Hardy-Weinberg Equilibrium frequencies P (AA) = p2 P (Aa) = 2pq p2+ 2pq + q2 = 1 P (aa) = q2
AA Aa aa Phenotype level Quantitative traits e.g. cholesterol levels
Components of Phenotypic Values • Phenotype (P) = Genotype (G) + Environment (E) • Considering variances (Var), this becomes: • Var(P) = Var(G) + Var(E) + 2 Cov(G,E) • G = A (additive genotypic value) + D (dominance deviation) • A: breeding value (i.e. the sum of the average effects of the two alleles) • D: intra-allelic interaction • In planned experiments, we can often take Cov(G,E) = 0 • Heritability
Heritability • Proportion of phenotypic variation in a population that is attributable to genetic variation among individuals • Variation among individuals may be due to genetic and/or environmental factors • Heritability analyses estimate the relative contributions of differences in genetic and non-genetic factors to the total phenotypic variance in a population.
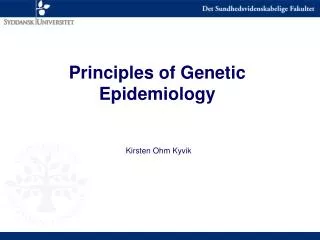
rMZ = rDZ = 1 rMZ = 1, rDZ = 0.5 E E ^ rMZ = 1, rDZ = C C e e A A c c a a Q Q q q Twin 1 mole count Twin 2 mole count
Twin study • One of behavioral genetics study design • Highlighting the role of environmental and genetic causes on behavior • Shared environmental influences common to members of family —class, parenting styles, education etc • Shared genes, inherited from parents • Compares the similarity between twins (MZ vs. DZ) • Modern history of the twin study derives from Sir Francis Galton's pioneering use of twins to study the role of genes and environment on human development and behavior
The Law of Hardy’s • Assumption • Radom mating, no selection, no mutation, no immigrant • Question: What’s the allele frequency between generations? • Two alleles (A, a) • F(A) = p, f(a) = q, p+q=1 • Frequency of genotype distribution AA, Aa, aa?
Allele frequency in the next generation • f(A) = p2 + ½ (2pq) = p(p+q) =p • f(a) = q2 + ½ (2pq) = q(p+q) =q • Therefore, under previous assumptions, allele frequency is unchanged over generations – i.e. reached equilibrium • Note: a German physician Wilhelm Weinberg made the same conclusion as Hardy so called Hardy-Weinberg Equilibrium (HWE)
Test for Hardy-Weinberg Equilibrium • Test for genotype frequency • Example: examining MN blood typing in 6129 Americans • Under HWE, test for χ2 = Σ(O-E)2/ E • First: f(M) = p = 0.539 f(N) = q = 0.461
Test for HWE (conti.) P=0.539, q=0.461 • f(MM) = p2 = 0.291, f(MN) = 2pq = 0.496, f(NN) = q2 = 0.212 • χ2 = 0.00489 • P(χ2,df=1 ) = 0.9 • Conclusion: MN blood patterns in this sample are in HWE
Linkage phase • For two loci, features of being in equilibrium means p(AB) = 2 p(A)p(B) • Linked two loci, say A1A2/B1B2 • Coupling phase • Repulsion phase
Linkage Disequilibrium • Gametic Association • At equilibrium, f(AB gamete) = PAB = PA× PB • Consider 2 alleles are at each of 2 loci with random mating, then there are ten possible zygotes • If r is the probability that a gamete is recombinant • In each generation, the amount of gametic disequilibrium, measured by PAB - PA PB , is reduced by a factor of r • PAB‘ = PAB – r D (where D = p11 p22 - p12 p21) • D: a quantitative measure of the amount of linkage disequilibrium
Linkage Disequilibrium (conti.) • Dt=(1-r)t D0 • Decay of linkage disequilibrium parameters between two loci depends on recombination fraction and time (generation) • Dmax = min (p1q2, p2q1), the largest positive value • When p11= p22 = 0.5& p12= p21= 0, max D = 0.25 • D´= D / Dmax, defined by Lewontin (1988)
Population Admixture • Admixture
D = PA1B2 PA2B1-PA1B1 PA2B2 = [m p1 q2+(1-m) P1 Q2]‧[m q1 p2+(1-m) P2 Q1] -[m p1 p2+(1-m) P1 P2]‧[m q1 q 2+(1-m) Q1 Q2] = m (1-m) (p1-P1) (p2-P2) • Only whenp1 = P1 or p2 = P2 or (p1 = P1 and p2 = P2), D = 0