Download
1 / 12
120 likes | 386 Vues
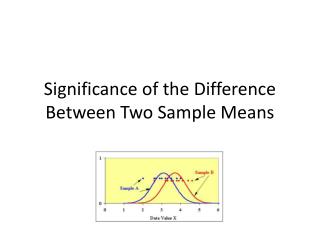
Chapter 13 – Difference Between Two Parameters. Math 22 Introductory Statistics. Dependent vs. Independent Samples. Independent Samples – Samples that are not related. Dependent Samples – Samples that are related.

E N D
Chapter 13 – Difference Between Two Parameters Math 22 Introductory Statistics
Dependent vs. Independent Samples • Independent Samples – Samples that are not related. • Dependent Samples – Samples that are related. Classic dependent data examples are “test and re-test” situation or a “before-and-after” situation.
Inferences Concerning The Ratio of Variances • When we compare two samples, one of things that we are concerned with is to see if population variances from each group are the same. • Since we do not know what the population variances are, we use sample variances to make this determination.
Inferences Concerning The Ratio of Variances • To see if the population variances are equal, we will use a hypothesis test based on the F – distribution.
Properties of the F-Distribution • The F-distribution is always non-negative (zero or positive) • The F-distribution is not symmetric, it is skewed right. • Like the t-distribution, the F-distribution is a family of distributions where each member is identified by the degrees of freedom.
Assumptions of the F-Test • The sample data was obtained from two independent populations • The distributions of both populations are normal.
Two Ways to Determine if the Population Variances are Equal • Method 1: Use the F-Test • Method 2: If the ratio of sample variances is less than 4. Then the population variances are equal If the ratio of sample variances is greater than (or equal to) 4. Then the population variances are not equal
Difference of Means • Difference of Means when Population Variances are equal. • Difference of Means when Population Variances are not equal.
Difference of Means: Nonparametric Alternative • If we look at the distributions from both sets of sample data and find both distributions are not normal, we should use a nonparametric approach. • If the distributions are similar, we will compare the means, if they are not, then we will compare the medians.
Difference of Means: Nonparametric Alternative • If both distributions appear to be similar We will compare a difference of means • If both distributions appear to be different We will compare a difference of medians
Inferences Concerning the Mean Difference Using Two Dependent Samples • When dependent samples are involved, the data is thought of being paired data. • Classic examples of paired data are the test/re-test situation and the “before and after” situation.
Other Hypothesis Tests and Confidence Intervals • Hypothesis Test Between Two Proportions • Confidence Interval Between Two Means • Confidence Between Two Proportions