Download
1 / 6
60 likes | 265 Vues
Chapter 9 Data Warehousing. Jason C. H. Chen, Ph.D. Professor of MIS School of Business Administration Gonzaga University Spokane, WA 99258 chen@gonzaga.edu. #3 Millennium College a. Star Schema. #3 Millennium College

E N D
Chapter 9Data Warehousing Jason C. H. Chen, Ph.D. Professor of MIS School of Business Administration Gonzaga University Spokane, WA 99258 chen@gonzaga.edu
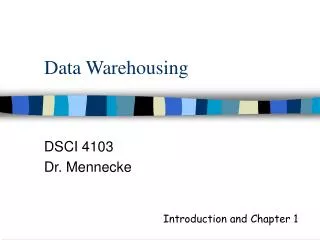
#3 Millennium College a. Star Schema
#3 Millennium College b. 500 course sections x 40 students per section x 30 periods (i.e., 3 semesters per year) x 200 professors = 120,000,000 rows (assuming 1professor per course section) 120,000,000 rows * 5 fields per row * 5 bytes per field = 3,000,000,000 bytes (3 Gigabytes)
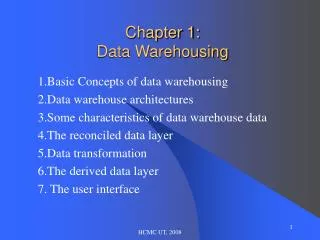
5. Simplified Automobile Insurance Company • Star schema: INSURED PARTY InsParty_D POLICY POLICY FACTS InsPartyName Polic_ID InsParty_D Type CoverageKey COVERAGE ITEM AgentID CoverageKey Policy_ID Description DateKey PolicyPremium PERIOD AGENT DateKey AgentID Deductible FiscalPeriod AgentName NoOfTrans
5. Simplified Automobile Insurance Company • Star schema:
To correctly estimate the number of rows, we must make some additional assumptions regarding the fiscal periods and the frequency of changes to policies. We assume the following: • 1. The length of a fiscal period is one month • 2. The data mart will contain five years of historical data • 3. Approximately 5 percent of the policies experience some type of change each month • 4. There are 8 fields in each record (row) Therefore, the expected number of rows is: .05 x 1,000,000 policies x 10 coverage items x 2 insured parties x 5 years x 12 months per year = 60,000,000 c. Total size of fact table: 60,000,000 rows x 8 fields x 5 bytes = 2,400,000,000 (2.4 Gigabytes)