Download
1 / 17
270 likes | 860 Vues
UV-Visible Spectroscopy. (ELECTRONIC SPECTROSCOPY). Pramod Kumar Singh School of basic Sciences & Research SBSR, Sharda University, Greater Noida, INDIA E mail: pramodkumar.singh@sharda.ac.in Ph. No.: +919971729840. Spectroscopy.

E N D
UV-Visible Spectroscopy (ELECTRONIC SPECTROSCOPY) Pramod Kumar Singh School of basic Sciences & Research SBSR,Sharda University,Greater Noida, INDIA E mail: pramodkumar.singh@sharda.ac.in Ph. No.: +919971729840
Spectroscopy When a beam of white light strikes a glass prism, it gets separated into its various coloured components (dispersion) By suitable arrangement of slits and lenses the different colours can be made to form a band of colours. This band of colours thus obtained is called a spectrum and the whole optical system for producing and viewing the spectrum is called a simple optical spectroscope.
Spectroscopy Production and study of the spectrum of white light is called spectroscopy Violet: 400 - 420 nm Indigo: 420 - 440 nm Blue: 440 - 490 nm Green: 490 - 570 nm Yellow: 570 - 585 nm Orange: 585 - 620 nm Red: 620 - 780 nm
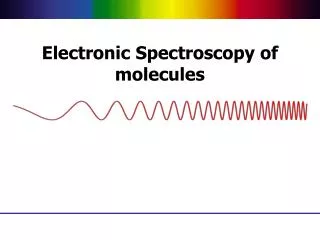
UV and visible light brings about movement of valence shell electrons(typically from a filled bonding molecular orbital to an unfilled antibonding orbital. Infrared radiation causes vibrational excitation of the molecular framework of a compound. Microwave radiation effects rotation around bonds.Radiowaves reorient nuclear spins.
Energy of molecules A molecule contains electronic, vibrational and rotational energy levels. Each electronic level, within a molecule, is associated with a number of vibrational levels with less energy separations and each vibrational level in turn is associated with a set of rotational levels with even less energy separations.
Both visible and ultraviolet spectra together are called electronic spectra of molecules and are found in the wavelength range (200 – 800 nm). 400 – 800 nm (visible spectral) 200-400 nm (ultraviolet spectra).
Energy of Molecules and Born-Oppenheimer Approximation Etotal = Eelect + Evib + Erot + Etrans Translational energy is negligibly small and hence Born-Oppenheimer approximation can be written as Etotal = Eelect + Evib + Erot In general Eelect > Evib > Erot
Electromagnetic radiation is an alternating electrical and associated magnetic force field in space. Thus an electromagnetic wave has an electric component and magnetic component. The two components oscillate in planes perpendicular to each other and perpendicular to the direction of propagation of the radiation
Beer-Lambert Law Beers Law states that absorbance is proportional to concentration over a certain concentration range A = cℓ A = absorbance = molar extinction coefficient (M-1 cm-1 or mol-1 Lcm-1) c = concentration (M or mol L-1) ℓ = path length (cm) (width of cuvette) A = Log10 (I0 / I)
when l = 1 cm and c = 1 g mol / litre then A = cℓ A = The molar extinction coefficient is therefore, the absorbance (or optical density) when the layer of the solution is 1 cm thick (i.e. ℓ = 1 cm) and the concentration of the absorbing substance is 1 gm moles per litre. The transmitted light or transmittance (T) is given as and the transmittance (T) is related with the absorbance (A) by the equation Thus, the optical density D, absorbance A and transmittance T are related as D = A = – log T
U. V. – Visible Spectrophotometer UV – visible spectrometers operate on the ‘double beam’ principle, with one beam passing through the sample and the other passing through a reference cell. The spectrometer has two lamps, one emitting light in the range 200 – 350 nm (UV) and the other in the range 350 – 750 nm (visible).
U. V. – Visible Spectrophotometer The light emitted by the source first passes through a diffraction grating i.e. monochromator, which breaks down the light into its component wavelengths in the same way as a prism. This light is then divided by curved mirror optics into two beams of equal intensity, one which passes through the sample, the other through the reference containing pure solvent.
U. V. – Visible Spectrophotometer Each beam is then focussed onto a detector which measures the ratio of the intensities of the two beams and the difference automatically converted and plotted out as the absorbance. *The strongest ratio of I0 / I that the instrument can tolerate is 100.
Presentation of spectra: Ultraviolet spectrum of (a) pyridine and (b) benzene in 95% ethanol
Analytical uses of UV spectroscopy :1. Absorbance of Smart Materials2. To study the reaction rate3. Study of charge transfer complex