Download
1 / 31
310 likes | 543 Vues
12.1a h.w : pg 759: 1 – 11 odd. Chapter 12 Inference for Linear Regression. Target Goals: I can make predictions using regression for normal distributions. I can check conditions for performing inference about the slope β of the population (true) regression line. Inference about the Model.

E N D
12.1a h.w: pg 759: 1 – 11 odd Chapter 12Inference for Linear Regression Target Goals: I can make predictions using regression for normal distributions. I can check conditions for performing inference about the slope β of the population (true) regression line.
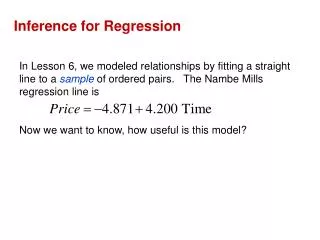
Inference about the Model • We can use LSRL fitted to data to predict y for a given value of x for two quantitative variables. • Now we will do tests and construct confidence intervals in this setting.
Ex. Crying and IQ • Infants who cry easily may be more easily stimulated than others and this may be a sign of higher IQ. • The researchers snapped a rubber band on the sole of the foot of infants and caused the infants to cry. • At age 3 years the measured IQ.
Step 1: Make a scatterplot of the data. • Explanatory variable: Crying • Response variable: IQ • Enter “crying” data into L1 and “IQ” data into L2. • Plot and Interpret. STAT:CALC:LinReg(a+bx) L1,L2,Y1 • Y1:(VARS:Y-VARS:FUNCT:Y1) • Scatterplot shows a roughly linear pattern. • The correlation r describes the direction and strength of the relationship.
Step 3: Identify outliers and influential points • Influential points • Outliers • No extreme outliers or potentially influential observations.
Step 4: Calculate the Correlation (r value) • The correlation between crying and IQ is r = 0.455.
Interpret r2 = 0.207, • only about 21% of the variation in IQ scores (response variable) is explained by crying intensity. • r2 is called the coefficient of determination. • Is prediction of IQ accurate with this model? No
It is interesting though that behavior shortly after birth can partly predictIQ.
Conditions for Regression Inference How long it will take before Old Faithful erupts again based on the duration of the previous eruption. 3 SRSs of 20 Old Faithful Eruptions The values of the slope b for the 1000 sample regression lines are plotted.
Conditions for Regression Inference Our goal is to predict the behavior of y for a given value of x. • Linear: The y responses for various samplesvary according to a normal distribution. The mean response μy has a straight-line relationship with x. • The true regression line is written in the form:
where μy is the mean response, and is the true y-intercept and β is the true slope.
Independent: The y responses are independent of each other. • Normal: for any fixed value of x, the observed response value y varies according to a normal distribution having mean μy.
Equal Variance: The standard deviation s about the true regression line is the same for all values of x. (constant). It is usually an unknown parameter. • Random:The data come from a well designed random sample or randomized experiment.
Linear • Independent • Normal • Equal Variance • Random
The LSRL := a + b x where b is an unbiased estimator of the true slope β and a is the unbiased estimator of the true intercept .
The line is the true regression line, which shows how the mean response μychanges as the explanatory variable x changes.
Standard Deviation • σ determines whether the points fall close to the true regression line (small σ) or are widely scattered (large σ). • This is also the size of a typical prediction error if we use the least-squares regression line to predict “how long it will take before Old Faithful erupts again” based on the duration of the previous eruption.
Ex: Slope and Intercept • The LSRL is = 91.27 + 1.493x • The slope measures rate of change: how much higher average IQ is for children with one more peak in their crying measurements. • b est. the unknown β; we est. that on the average IQ is about 1.5 points higher for each additional crying peak. crying peak IQ
Standard Deviation • σ describes the variability of the response y about the true regression line. • Recall that residuals estimate how much y varies about the true line and are the vertical deviations of the data points from the least-square line: • Residual = observed y – predicted y
Standard Error about the LSRL • We estimate σ with s, the sample standard deviation, which is also called the standard error(this is the key to inference about the regression). • Since σ is unknown, we use s to estimate the value of σ. • Note:(n – 2) is the degrees of freedom for the regression model.
Ex. Calculating Residuals and Standard Error The quickest way to do this is to: (use ex 14.1 data). • Enter “crying” data into L1 and “IQ” data into L2. (We already did this.) • Recall: LINREG (a+bx) automatically calculates the residuals and stores them in “Resid.” • Store “Resid” in L3 • STAT:CALC:1-Var StatsL3 ∑resid2
To find s, first find s2: • To find s2: • Enter the value of ∑X2 by hand or (VARS:5: : ∑X2 ) and divide by (n-2) • Take sqrt to find s.
A level C confidence interval for the slope b of the true regression line is
You will rarely have to calculate this by hand. • Regression software gives you the standard error SE b and b itself.
There are 38 data points so df = n – 2 = 36. • Find the critical value t* (critical value). For a 95% C.I. for true slope b, use critical value t* = 2.042 with df =30 from table C.
Conclude • We are 95 % confident that mean IQ increases by, between 0.5 and 2.5points, for each additional peak in crying.
Interpret SEb • Sebestimates how much the slope of the sample regression line typically varies from the slope of the population (true) regression line if we repeat the data production process many times. • If we repeated the experiment many times, the slope the slope of the sample regression line would typically vary by about .4870 from the slope of the true regression line for predicting IQ from cry count of infants.