Download
1 / 12
120 likes | 208 Vues
Multi-Scale Analysis of the Kinematic and Thermodynamic Structure of TS Humberto Using Dropsonde and Satellite Data . Jeffrey B. Halverson, UMBC Alex Martin, UMBC. Research Objectives. Multi-scale analyses: Satellite, environmental, in situ dropsonde structure

E N D
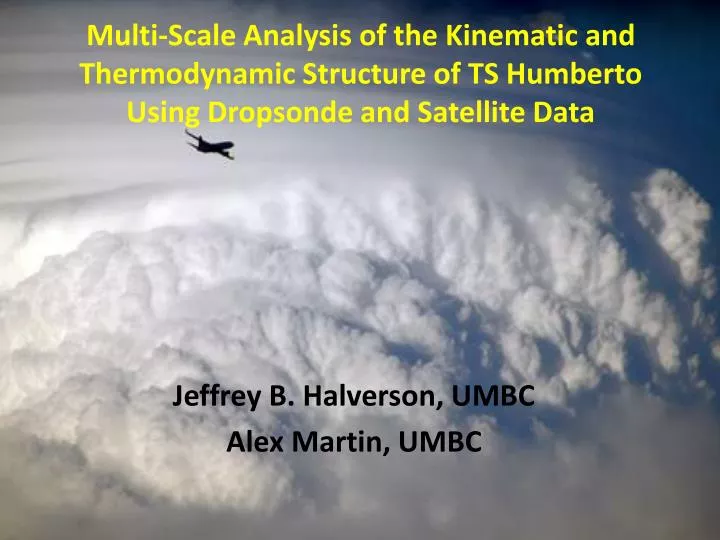
Multi-Scale Analysis of the Kinematic and Thermodynamic Structure of TS HumbertoUsing Dropsondeand Satellite Data Jeffrey B. Halverson, UMBC Alex Martin, UMBC
Research Objectives • Multi-scale analyses: Satellite, environmental, in situ dropsonde structure • Study warm core, vortex symmetry, shear interactions, SAL interactions – in context of a “dud” TC season with hostile synoptic environment (i.e. dry air, subsidence) • Develop 3D structural visualizations utilizing a GIS framework • Hurricane Humberto (2013) • Hurricane Gabrielle (2013) • Upcoming 2014 cases • 17-year TC dropsonde climatology
Humberto Case Study • Developed on September 7th, 2013 • Became TS strength on September 9th • Reached peak intensity on September 14th at 80 knots • Sampled by AV-6 on Sept 16-17 using racetrack pattern • Developed deep convection in north portion • Highly asymmetric, disjointed storm structure Snapshot of Humberto at peak intensity
85 GHz 37 GHz 4 Hours before first drop 21 minutes after first drop 85 GHz IR 7 minutes after last drop 55 minutes before last drop
Wavenumber 1 Asymmetry 0145 UTC IR imagery Mature DMC Subsidence Region Initiation Of DMC White arrow represents shear vector; black arrow is storm motion • Strong, unidirectional deep shear interacting • with storm • - Magnitude of shear vector = 23 m/s • Strong asymmetry /wrt/ vortex and deep • convective region • Suggestive of a wave-number one structure 0437 UTC 85 GHz Microwave Imagery
GIS ArcScene Analysis – 3D visualization Deep Layer Shear 270° 23 m/s x x x x Storm Motion vortex center x
Composite Dropsonde Structure Deep Shear Examine thermodynamic and kinematic structure using framework of downshear and upshearquadrants (RAOB software)
0015 UTC 0305 UTC 0408 UTC
Humberto Case Study Summary • Highly asymmetric, struggling TC • Low level vortex center exposed • Deep moist convection (DMC) displaced to north of center • Vortex wind maxima in NE quadrant /wrt/ deep shear vector • DMC triggered in NE quad, within low level speed convergence zone • Overall structure may be linked to strong wave number one asymmetry • Shallow, weak warm core on southern edge of DMC mass (likely subsidence induced) • Need to better understand if there is any SAL interaction • Need to develop understanding of large-scale environmental (hostile) context for the storm’s mesoscale structure
NCAR Dropsonde Re-Analysis • 1996 to 2012 NOAA dropsonde dataset • Build composite vertical profiles inside Atlantic basin TC eye, eyewall, rainbands, surrounding environment • Composites as a function of radial distance, quadrant /wrt/ motion vector, storm intensity • PBL wind structure, • 120 tropical cyclones included • 13,681 quality controlled soundings • Article by J. Wang et al. submitted to BAMS