Download

1 / 36
360 likes | 649 Vues
Analysis and understanding of complex neural systems. Peter Andras School of Computing and Mathematics Keele University p.andras@keele.ac.uk. Overview. Brain area networks Network analysis – issues and approaches Networks of biological neurons Modelling neural systems. 2.

E N D
Analysis and understanding of complex neural systems Peter Andras School of Computing and Mathematics Keele University p.andras@keele.ac.uk
Overview • Brain area networks • Network analysis – issues and approaches • Networks of biological neurons • Modelling neural systems 2
Brain area networks • CoCoMac database – connectivity of brain areas in cat and macaque (brain areas defined in histological sense) • Connectivity ~ estimate of the number / relative importance of connecting axons • E.g. V1 receives around 5% of its inputs from LGN
Erdos-Renyi vs Scale-free networks • Erdos-Renyi networks: uniform probability of links between any two nodes exponential distribution of connectedness (P(k)=exp(-*k))– very few highly connected nodes • Scale-free networks: more connected nodes are more likely to be linked to other nodes power law distribution of connectedness (P(k)=k^(-)) – some very highly connected nodes 4
Implications of being scale-free • Scale-free networks are robust to random damage, but vulnerable to well-targeted damage 5
Are brain area networks scale-free ? • Networks: around 60 nodes with 600 – 800 connections – small networks • Measurements of such small size networks may be misleading
Comparison of networks • Method: • measure key parameters of these networks (average clustering coefficient and average connectivity) • generate a set of scale-free networks and a set of exponential networks with the same parameters • test statistically whether the brain networks behave in the same way or not in terms of damage measures as the random sample of scale-free or exponential networks – test both random and targeted damage
Determination of scale-free-ness • The analysis shows that the brain networks are more similar to scale-free networks than to exponential networks • However, in terms of the evolution of the average clustering coefficient under targeted node elimination the brain networks are more similar to exponential networks Macaque brain network with random and targeted node elimination Kaiser M, Martin R, Andras P, Young MP (2007). Simulation of structural robustness of cortical networks. European Journal of Neuroscience, 25 (10): 3185-3192.
Recent works • Area connectivity from DTI using MRI data • Viral tracing data From: neuroimaging.tau.ac.il From: www.painresearchforum.org
Network analysis issues • Data about real world large scale networks are not easily accessible – expensive, private, noisy • Network analysis methods are often tried and tested on artificial surrogate data • The validity and meaningfulness of these methods may be questionable
Example: searching for new antibiotic targets – 1 • Node importance – contribution to structural network integrity • Key assumption: structural and functional integrity correlates well • Centrality measures: • Connectedness – Hubs • Betweenness – Bottlenecks • Aim: find pairs of joint targets B. subtilis Idowu, O, Andras, P (2005). Identification of functionally essential proteins from protein interaction networks. In: Proceedings of CIMED 2005, pp.330-333.
Example: searching for new antibiotic targets – 2 • 12 predictions of pairs of potential joint targets • 2 years of experiments with mutant bacteria – 1 postdoc + lab costs • Result: some predicted target pairs lowered the growth rate of the bacteria, but none did it is sufficiently to qualify as an effective antimicrobial combination
How to improve the validity of network analysis methods ? • Get large volume of valid, cheap, and reliable data • Large-scale software: • System of interactions between objects / classes • Dynamic analysis provides data about what actually happens in the software • Repeatable, easy to vary experiments generating large volumes of reliable data quickly and cheaply
Example: analysing Google Chrome • Many developers • Development over extensive time period • Integration of many components, patches, bug fixes • 6 million lines of code
Google Chrome – functionally important method calls • A method call is functionally important if it’s correct execution is critical for the positive user experience in the context of an execution scenario (e.g. delivery of a software behavioural feature) • Network analysis based prediction methods using hub and between-ness centrality based ranking Pakhira, A, Andras, P (2012). Using network analysis metrics to discover functionally important methods in large-scale software systems. Proceedings of the 3rd International Workshop on Emerging Trends in Software Metrics (WETSoM 2012), pp.70-76. Pakhira, A , Andras, P (2012). Leveraging the cloud for large-scale software testing – A case study: Google Chrome on Amazon. In: Tilley, S & Parveen, T (eds.) Software Testing in the Cloud, Information Science Reference – IGI Global, Hershey, PA, pp.252-279.
Summary – 1 • Increasing volume of improving quality data is available about brain-scale connectivity • Meaningful network analysis requires validated analysis methods, which requires large volume of accessible and good quality network data • Dynamic analysis of large scale software can be used to generate this required data
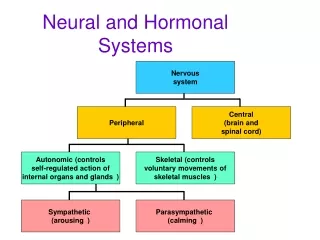
Biological neural networks • How do biological neural networks deliver their emergent functionality ? • Do neurons change their functional identity ? • Which neural system can provide data with sufficient detail and quality ?
Crab stomatogastric ganglion • 26 neurons arranged in a relatively flat sheet • Relatively isolated (one input nerve from higher ganglia) • Complex behaviour – central pattern generators (CPG ) • Ideal model system for studying neural activity patterns
VSD imaging of the crab STG • Di-4-ANEPPS dye (20µl stock solution in 1 ml saline; stock: 5mg dye + 1ml DMSO/Pluronic acid) • Vaseline well around the ganglion • Bathing in dyed saline for 30-40 minutes • Washing with dye-free saline for 30 minutes • Works for crab and lobster as well Stein, W, Städele, C, Andras, P (2011). Single-sweep voltage sensitive dye imaging of interacting identified neurons. Journal of Neuroscience Methods, 194:224-234 Stein, W, Städele, C, Andras, P (2011). Optical imaging of neurons in the crab stomatogastric ganglion with voltage-sensitive dyes. Journal of Visualized Experiments, doi: 10.3791/2567.
Identification of STG neurons Städele, C, Andras, P, Stein, W (2012). Simultaneous measurement of membrane potential changes in multiple pattern generating neurons using voltage sensitive dye imaging. Journal of Neuroscience Methods, 203: 78-88
Quantification of the effects of dopamine Depolarized activity plateu • Feature points: • minimal slope • maximal slope • beginning of top zero slope • end of top zero slope • Trace features: • length of depolarized activity plateu • length of hyperpolarised inhibition period • Joint activity features: • length of temporal distance between matching feature points Hyperpolarised inhibition period Delay between matching feature points
Dopamine impact on PY neurons • The hyperpolarised inhibition period gets longer under the impact of dopamine • The depolarised activity plateau gets shorter under the impact of dopamine
Dopamine impact on joint activity of PY neurons • The dopamine has differential effect on different PY neurons, shifting their feature points differently through the modulation of their activity De-synchronisation of PY neurons
Conductance variability • The conductance of ionic currents is variable across the same kind of neurons within a single animal and across animals • Ratios of certain ionic current conductances seem to be stable (e.g. gH and gA relative to gK) • Neuromodulators, like DA, can change protein expression in short- and long-term as well, potentially shifting the conductance combination state of affected neurons
PY neuron roles • Early- and late-PY or PYs along a scale from early to late • Relative temporal order or distance of activity • Can PY neurons change their roles in response to neuromodulation ?
PY neurons following re-synchronisation • The relative temporal ordering and/or time distance of PY neuron activities changes
Differences of PD neurons • 2 PD neurons in the crab STG – part of the AB/PD pacemaker • There is a temporal delay between the spikes of the two PDs • Does this delay have a functional significance, is it always the same PD which leads, do they change their roles ?
Modelling differences of PD neurons • Different gK and gCaS conductance values explain observed delayed joint PD activity patterns
Related work – Dye design • Aim: to design novel voltage-sensitive dyes with better response than current ones to improve signal/noise ratio and data quality • Bodipy molecule based dyes – e.g. JULBD Bai, D, Benniston, AC, Clift, S, Baisch, U, Steyn, J, Everitt, N, Andras, P (2014). Low molecular weight Neutral Boron Dipyrromethene (Bodipy) dyads for fluorescence-based neural imaging. Journal of Molecular Structure, 1065-1066: 10-15
Related work – Neural system functionality restoration • Optogenetic silencing of selected neuron(s) – e.g. PD-s, LP • FPGA simulated neurons connect to the STG through an MEA to replace the activity of the inactivated neuron(s) • Aim: to restore the normal functional behaviour of the STG • Potential for a novel approach to neurochip implants
Summary – 2 • The crab STG is a great model neural system for the study of emergence of system level functionality in biological neural networks • VSD imaging can provide detailed data to study • The functional stability/variability of neurons • The impact of neuromodulation on neuronal and network functionality • Computational modelling of the STG can explain a range of observed feature and also can guide the experimental investigations
Acknowledgements • Network analysis: • Marcus Kaiser, OlusolaIdowu, Malcolm P Young, AnjanPakhira • VSD imaging • Wolfgang Stein, CarolaStaedele, JannettaSteyn • Computational modelling • Thomas Alderson, JannettaSteyn • Other STG related work • Andrew Benniston, Jun (Ryan) Luo, JannettaSteyn 35
Thank you! 36