Download
1 / 37
1.22k likes | 2.45k Vues
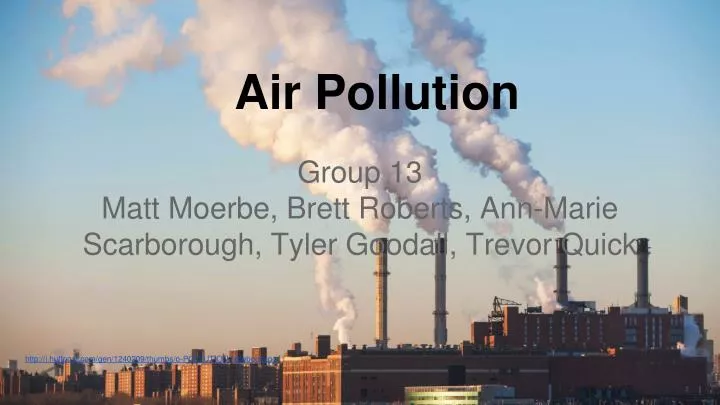
1. Air Pollution. Group 13 Matt Moerbe, Brett Roberts, Ann-Marie Scarborough, Tyler Goodall, Trevor Quick . http://i.huffpost.com/gen/1240209/thumbs/o-POLLUTION-facebook.jpg. 2. What is Air Pollution?. The release of harmful substances that can harm the environment and humans

E N D
1 Air Pollution Group 13 Matt Moerbe, Brett Roberts, Ann-Marie Scarborough, Tyler Goodall, Trevor Quick http://i.huffpost.com/gen/1240209/thumbs/o-POLLUTION-facebook.jpg
2 What is Air Pollution? • The release of harmful substances that can harm the environment and humans • EPA created the Clean Air Act to have regulations against acts against the environment • Two main approaches to reducing emissions into the atmosphere • Change the process that contributes to emissions • Adding pipe to the end of a process to remove and treat contaminants http://environment.nationalgeographic.com/environment/global-warming/pollution-overview/
3 Clean Air Act EPA Clean Air Act violations and the resulting punishments
4 High Priority Violators of CCA http://www.npr.org/news/graphics/2011/10/toxic-air/#5.00/39.358/-93.580
5 Advantages of the Clean Air Act • For over 40 years the CAA has cut pollution in the U.S. • The health benefits of the CAA exceed the costs of reducing pollution • New types of technology have been developed because of it etc. automobiles, plants, and factories • The act also promotes heavily for the develop and deployment of cleaner technologies http://www.ametsoc.org/sloan/cleanair/cleanairlegisl.html http://www.climaticoanalysis.org/post/the-epa-finds-greenhouse-gases-to-be-dangerous-but-what-does-that-mean/
6 Advantages of the Clean Air Act http://www.epa.gov/air/caa/progress.html This table demonstrates how air emissions are dropping from 2010 to 2020 and in what categories
7 Clean Air Act violation • August 2009 in Illinois • A guy named O’Malley was hired by a guy named Pinski • Pinski was the manager of Dearborn Management Inc. • O’Malley was the owner and operator of Original Fire Protection • O’Malley’s company was hired to remove and dispose of asbestos from Dearborn’s piping system • During investigation O’Malley was found out to be a fraud in the removal of abestos. His company was not trained and he also accepted to perform the job at a cheaper price than a competing company who was trained in the removal. • O’Malley fines • 120 months in jail, 36 months probation, and he had to pay a fine of $15,000 to the federal government, and $47,086 to the EPA for having to clean up their mess • Pinski fines • Sentences to half a year in prison, 2 years of release from work, • and half a year home detention http://www.mesothelioma24.com/wp-content/uploads/2013/07/asbestos-removal.jpg http://www.kkes.com/asbestos.html
8 Pollution Prevention • Change the way we use fuel • Substitute less toxic materials • Reduce the formation and fabrication of materials and byproducts • Capture and conduct studies on potential pollutants http://www.lanl.gov/community-environment/environmental-stewardship/sustainability/pollution-prevention.php
9 Air Pollution Control (APC) Equipment • APC equipment can help control emissions by these ways: • Destroy and capture possible pollutants • Convert these pollutants to less-toxic materials or compounds • Remove all pollutants from the air http://www.corrocare.com/air_pollution_control_equipment.html
10 Gas Absorption • One of the most common methods for reducing air pollution • Pollutants are removed by dissolving into the scrubbing solution (usually water). http://www.cxyh.cc/english/productsshow.asp?id=33&type=11
11 Gas Absorption • Commonly used to reduce CO2 amounts in furnaces. • The final product is leaving the scrubber at less than 500 ppm CO2 http://www.scielo.org.ar/img/revistas/laar/v33n2/2a21g341.gif
12 Gas Absorption Reactants can also be added into the scrubbing solution to remove pollutants via chemical reaction. Ex: adding hypochlorite to the scrubbing solution allows sulfur-containing compounds to react with the solution, which can reduce odor. Conditions necessary for gas absorption: • Water-soluble pollutants • Particulates This figure shows 2 types of absorbers http://www.wes-worldwide.com/_image/wes-absorber-comparison.jpg
13 Gas Absorption • The most common type of absorption for reducing pollutants in air is through a Gas-liquid interface, as shown in figure (a) to the left. • When gas is bubbled through the liquid, gas molecules are absorbed. • Note that this is not adsorption (which can also be used to reduce pollution). Adsorption requires that the molecules adhere to the surface of other molecules. http://en.wikipedia.org/wiki/Sorption
14 Visualizing Gas Absorption • This is another way to visualize the absorption process. • The red arrow represents polluted gas entering a chamber. • The pollutants (red) are then absorbed by water molecules as they rise through the chamber • Purified air (white) is then released through the top of the chamber
15 Measuring Air quality After the absorption process, it is useful to be able to measure the quality of purified air. This can be done using the following Matlab code: % I = Air quality Index % C = Pollutant Concentration % Clow = Concentration breakpoint less than C % Chigh = Concentration breakpoint greater than C % Ilow = Index breakpoint for Clow % Ihigh = Index breakpoint for Chigh Clow=35.5 Chigh=55.4 Ilow=101 Ihigh=150 I=((Ihigh-Ilow)/(Chigh-Clow))*(Chigh-Clow)+Ilow I=149.999999 % AQI approx. 150 means air is potentially unhealthy to the population http://www.health.state.mn.us/divs/climatechange/images/smokestack.jpg
16 Optimizing Gas Absorption Adding arsenite increases the rate of absorption of CO2 with respect to NH3. Arsenite allows absorption to continue past a 1:1 ratio. With no arsenite, absorption becomes very ineffective at this point http://pac.iupac.org/publications/pac/pdf/1965/pdf/1004x0625.pdf
17 Condensation • Highly effective for VOC’s • Separates pollutants by rapidly decreasing temperature or increasing pressure, causing them to condense and drop out • This tower is used for Cryocondensation. Cryocondensation can purify many solvents. These include toluene, acetone, methanol, chlorinated derivatives, and hydrocarbons. http://condorchem.com/uploads/content/filename/thumb/header/crio.png
18 Thermal Oxidizers/Incinerators • Destroys volatile organic compounds (VOCs) and volatile hazardous air pollutants (HAPs) by high temperature destruction (~1200-1800 °F) • High thermal energy breaks covalent bonds • Pros - • high efficiency (>99.9% if well-designed) • good for variable VOC loads • highly reliable • Cons - • insufficient residence time causes toxic byproducts • required fuel is expensive, produces CO2 and NOx gasses • must be fabricated from highly temperature resistant materials http://www.epa.gov/ttnchie1/mkb/documents/Thermal_Oxidizer_Schematic.pdf
19 Thermal Oxidizers - Liquid Injection • Used primarily in chemical industry to destroy the liquid wastes that contain organic toxins • Liquids get atomized through nozzles, exposed to burner flames, get vaporized and become superheated • Superheated gas combined with air in a turbulent zone • Residence time varies based upon flow volume, usually ~.5-2.5 s • Toxic liquid waste gets oxidized to produce CO2, H2O, O2, N2, and acid gases • Acid gases must be cleaned from exhaust stream by using wet scrubbers http://www.tske.co.jp/english/technology/nensyo_injector.html
Recuperative Thermal Oxidation: Utilizes shell-and-tube heat exchanger to capture excess heat, which can be used to preheat incoming waste gas 20 Improvements to Thermal Oxidizers Regenerative Thermal Oxidation: • Recovers and reuses >90% of thermal energy from combustion chamber by utilizing a ceramic material as a heat sink to remove heat from the exhaust downstream of the unit • The ceramic material preheats incoming waste gas, reducing the amount of fuel required for oxidation Images from original article
21 Catalytic Oxidizers/Incinerators • Destroy VOCs and volatile HAPs by high temperature destruction • Utilizes catalyst to lower destruction temperature (~650-900 °F) • Pros - • high control efficiency • good for variable VOC loads • very reliable • lower temperature compared to thermal oxidizers, means significant fuel savings • Cons - • catalysts may plug and become ineffective • expensive to dispose of spent catalysts • Can utilize same improvements as thermal oxidizers (regen. & recup.) http://www.epa.gov/ttnchie1/mkb/documents/Catalytic_Oxidizer_Schematic.pdf
22 Carbon Adsorption • Removes some VOCs which have a high affinity for carbon by surface adsorption • benzene, phenol, vinyl chloride, xylene, toluene, acetone, sulphur-containing compounds • Pros - • able to recover contaminants for reuse • Very high control efficiency • Carbon is relatively cheap • Cons - • only removes some VOCs • not as effective if load varies • particulate matter can plug the carbon bed http://image.made-in-china.com/2f0j00RMsTiuoWYqgk/200-325mesh-Powder-Activated-Carbon-POWAC-.jpg http://activatedcharcoal.com.au/wp-content/uploads/2011/03/charcoal1.jpg
23 Carbon Adsorption • Most systems consist of two beds • Waste gas is passed over one bed and undergoes adsorbing process, while steam passes over the other bed and undergoes a desorbing process • After a period of time the process streams are switched, so that the beds alternate between adsorption and regeneration processes • Most carbon adsorption processes utilize a prefilter to remove particulate matter that would otherwise plug the carbon beds http://www.epa.gov/ttnchie1/mkb/documents/Regenerative%20Carbon%20Adsorber_5-5-05.pdf
24 Carbon Adsorption - Freundlich • The Freundlich Adsorption Equation is used to compare adsorptive capacity of different activated carbons • X/M=KC^(1/n) • It is often more convenient to express in logarithmic form to perform calculations and fit data • These logarithmic plots are referred to as Freundlich Adsorption Isotherms (FAI) • These plots are useful because they: • determine if a desired purity level is possible with the specific carbon • allow for calculation of carbon loading at equilibrium • can be used to predict the relative performance of different types of carbon • higher isotherm line means better adsorptive capacity http://www.norit.com/files/documents/Isotherm_Test_rev2.pdf • A MATLAB function to calculate carbon loading at equilibrium , plot the FAI and compare two different carbons is shown on the next slide.
25 Carbon Adsorption - MATLAB Mold=M;Cold=C;Xold=X; n=length(C); if n ~= length(M) && n~= length(X) error('length of M,C, and X must be same');end b=X./M; if M(1)==0 for k=1:n-1 b(k)=b(k+1);C(k)=C(k+1);end b=b(1:n-1);C=C(1:n-1);n=length(C);end blog=log10(b);Clog=log10(C); a=polyfit(Clog,blog,1); xx=linspace(Clog(1),Clog(n)); for i=1:length(xx) yy(i)=a(1)*xx(i)+a(2);end plot(log10(C),log10(b),'xr',xx,yy,'--k'),grid xlabel('log(C), impurity remaining'),ylabel('log(X/M), carbon loading'),title('ADSORPTION ISOTHERM') CL = 10^(polyval(a,log10(Co)));delC = Cold(1)-Co;Crate = delC/CL;end function [Crate] = carbadsorp(M,C,X,Co) %function to generate Freundlich Adsorption Isotherm %M(1) must correspond to lowest C dosage %C(1) must be initial impurity %INPUTS: %X = amount of impurity adsorbed at equilibirum (mg/L) %M = carbon dosage (g/L) %C = concentration of impurity remaining in solid (mg/L) %Co= desired final impurity level %OUTPUTS: %CL = carbon loading at Co (mg/L) %delC= impurity removal (mg/L) %Crate= carbon usage rate Plot for carbadsorp(M2,C2,X2,20) From scipt on next slide
26 Carbon Adsorption - MATLAB Results Plot for carbadsorp(M1,C1,X1,20) The following script can be used as an example: >> M1 =[0 .4 .8 1.6 3.2 9.75]; >> C1 =[400 248 164 92 34 10]; >> X1 =[0 152 236 308 366 390]; >> M2=[0 .4 .8 1.6 3.2 15]; >> C2=[400 280 200 120 60 9]; >> X2=[0 120 200 280 340 391]; >> carbadsorp(M1,C1,X1,20); >> (ans-carbadsorp(M2,C2,X2,20))/ans*100 ans = -47.2968 These results show that approximately 55% more of Carbon 2 is required to obtain the same treatment results as Carbon 1. This data can now be used to determine which carbon is more suitable for use in a regenerative carbon adsorber by comparing the cost and efficiency of each.
27 Electrostatic precipitation overview • The Electrostatic precipitation (ESP) technique is another effective solution to reduce air pollutant in the air. • Utilizes induced electrostatic charge to remove particulars from the gas. • Very effective at removing particles from the gas because the flow is uninterrupted and energy is only used removing the particles. • With regards to air pollution, ESP first polarizes the pollutants and collects them while allowing the cleaner air to flow through. ESP Industrial Air Filter, image from: www.Alibaba.com/product-gs/280530729/ESP_Electrostatic_Precipitator_Industrial_Air_Filter/
28 Electrostatic precipitation continued • Electrostatic precipitator has two important steps: the charging step and the collection step. • During the charging step the particles in the gas are charged (positively) from the wires. Afterwards, the particles are collected by the negatively charged collecting plates while clean air is unimpeded. Picture to the right illustrates the process. • One very important characteristic to consider therefore is the resistivity of the particle. Resistivity is the measure of resisting power of a material to flow current. Resistivity= Resistance*Area cross-section/Length • If the resistivity is too high, the particle will not be charged sufficiently, too low and the particle will not stick on the collecting plates. • Ideal resistivity of the particles is 107-2*1010 ohm-cm as shown on the left. ESP process microscopic view, image from: www.air-quality-eng.com/eac.php Graph of efficiency versus resistivity, image from: www.hitachi-pt.com/products/energy/dustcollection/principle/dustcollection.html
29 Dust collection efficiency calculations • The effectiveness of an electrostatic precipitator separating particles of medium resistivity can be determined by its dust collection efficiency. • η = 1-exp(-a*k*t) Where a=area, k=device constant, and t is the treating time • Matlab m-file for calculation of efficiency assuming spherical particle: function ElectroStaticEff(r, k, t) % r is the radius of the particle being removed % k is a device constant defined by experiments % t is the treating time a=4/3*pi*r^3; n=1-exp(-a*k*t) end • As shown above, the effectiveness of electrostatic precipitator is highly dependent on the area of the particle. Smaller particles greatly reduces the efficiency of the process. • Typical values range .80-.99, efficiency below .8 are better off using a different filtration process. Visualization of process, image: http://www.flsmidth.com/en-us/eHighlights/Archive/Minerals/2011/May/COROMAX+pulse+system
30 Electrostatic precipitator conclusion However, small particles do not stick to wall • Pros for ESP: • Efficient process to separate pollutants from the air. • Low operating cost • Temperature independent • Very high efficiency for medium to large sized particles. • Cons for ESP: • Very large machine • Cannot separate very high or very low resistivity particles-- needs a certain range • Cannot separate very small sized particles. • Currently, the most popular industry uses for ESP process are smokestack to remove harmful air pollutants from the exhaust. Large enough particles stick to the collecting stations Air passes through along with pollutants
31 Baghouse introduction • Baghouse filtration is a different method which can control emissions. • Focuses on removing the pollutants from the air, as with electrostatic precipitation. • Baghouse filtration is always very efficient, very common collection efficiency rate is 99.9%. Furthermore, collected pollutants can be recycled to the parent process to be used as heat. • Particle size is not a limiting factor for baghouse filtration, can collect particles large and small. Example of baghouse filtration, picture taken from: http://www.lyroad.com/images/bdcc.jpg
32 Baghouse filtration continued • During the baghouse filtration process dirty gas is run through the walkways and out through the exhaust. • The walkways are made from felted fabric which can be as small as the particles needed to be filtered. • The particles are left behind and form a cake layer on the fabric. • Once the cake layer is so dense that the flow of gas has stopped, the walkways are shaken which drops the particles into a collector to be recycled if capable. The process is then repeated. Example of walkways, picture from http://www.gore.com/resources/corporate/MungoBlobs/356/776/baghouse-filters-mosaic.jpg
33 Baghouse filtration calculations • Pressure drop across the baghouse filter is necessary to know in order to utilize the filter. Pressure drop is the sum of the pressure drop across the filter and the pressure drop across the cake, numerically given below. Matlab program given below. • ∆Pf=k1*Vf ∆Pc=k2*Ci*Vf2*t Where k1:fabric drag, Vf: filtration velocity, k2: Resistance of cake, Ci: Dust concentration loading, t=filtration time • Filtration Velocity (or air-to-cloth ratio) is another quantity helpful to define. • Vf= Q/(Ac) Where Q: volumetric flow rate, Ac: Area of cloth filter Clean air passes through function BaghousePressure(k1, Q, Ac, k2, Ci, t) % k: fabric drag coefficient % Q: volumetric flow rate % Ac: area of cloth filter % kk: cake resistance coefficient % Ci: Dust concentration loading % t: filtration time Vf= Q/AC PF=k*Vf PC=kk*Ci*Vf*Vf*t P=PF+PC end Cake layer builds up on the end http://www.granitecitytool.com/sites/default/files/ATT00129.jpg Dirty air enters the walkway
34 Baghouse filtration conclusion • Pros for baghouse filtration: • Very efficient filtration over 99%. • Able to separate the small particles that other filtration methods cannot. • Collected particles can be recycled and used for heat. • Cons for baghouse filtration: • Time must be spent cleaning the walkways once the air flow stops. • Cost can be higher upfront. • If an air bag breaks, the entire process must be stopped in order to replace the bag. Often times the particles are toxic to humans and difficult to clean if it breaks. Example process of baghouse, taken from: http://www.neundorfer.com/FileUploads/RichTextboxImages/Image/reverse_air_baghouse.jpg
35 Conclusions-Prevention Methods • The most cost effective way to reduce air emissions is by implementing pollution prevention method and improving efficiency of process to consume less materials and energy • However, efficiency improvements have limits and APC technologies will be needed to overcome these limitations. • The figure shows gives an example of how and plant first attempts to change their process using prevention methods to reduce pollution before moving on to other less preferred options. http://www.istc.illinois.edu/info/library_docs/manuals/finishing/images/fig05.gif
36 Conclusions-Air-Pollution-Control •Due to diverse nature of plant’s processes, raw materials, and emissions, certain plants may require different types APC equipment. •It is important to understand the fundamental principles behind: •APC technologies •Processes being used •Contaminants to be controlled •Exhaust stream composition •To determine which APC will be most efficient, reliable, and cost-effective as an air pollution strategy. •This table summarizes the APC technologies basic fundamentals. Table from original article
37 Future work in topic • Improvements are ideally made at the upstream level, decreasing the pollutants originally formed. • Future work in APCs could include more efficient designs of any of the procedures outlined above. • Otherwise new methods could be created which could combine methods used above or reduce their disadvantages. http://4.bp.blogspot.com/_AcBUSVxs82w/S_6TbN_vbII/AAAAAAAAdRQ/-CVo4p0zXJ8/s1600/Air-Pollution.jpg