Download
1 / 31
330 likes | 491 Vues
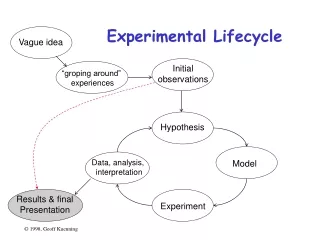
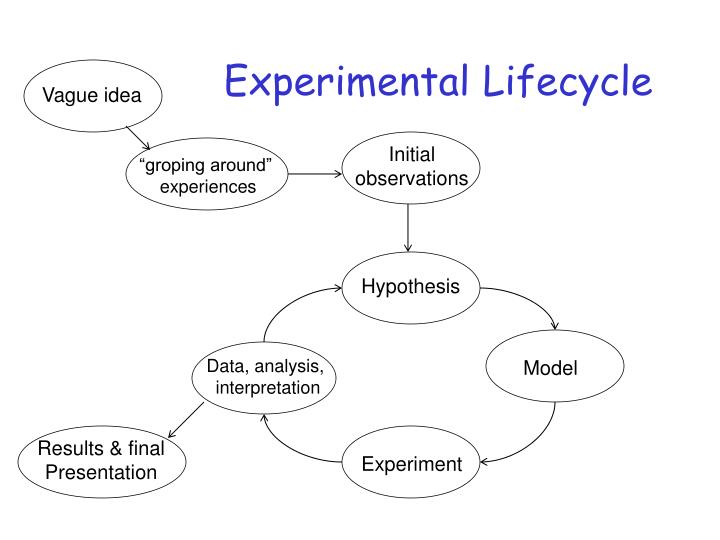
“groping around” experiences. Vague idea. Initial observations. Hypothesis. Model. Experiment. Data, analysis, interpretation. Results & final Presentation. Experimental Lifecycle. A Systematic Approach.

E N D
“groping around” experiences Vague idea Initialobservations Hypothesis Model Experiment Data, analysis, interpretation Results & finalPresentation Experimental Lifecycle
A Systematic Approach • Understand the problem, frame the questions, articulate the goals.A problem well-stated is half-solved. • Must remain objective • Be able to answer “why” as well as “what” • Select metrics that will help answer the questions. • Identify the parameters that affect behavior • System parameters (e.g., HW config) • Workload parameters (e.g., user request patterns) • Decide which parameters to study (vary).
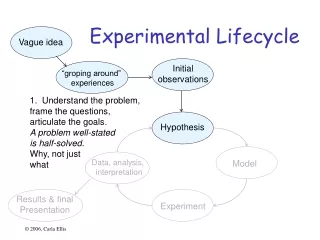
Experimental Lifecycle Vague idea Initialobservations “groping around” experiences 1. Understand the problem,frame the questions, articulate the goals.A problem well-stated is half-solved. Hypothesis Data, analysis, interpretation Model Results & finalPresentation Experiment
An Example • Vague idea: there should be “interesting” interactions between DVS (dynamic voltage scaling of the CPU) and memory, especially PADRAM (power-aware memory) • DVS: in soft real-time applications, slow down CPU speed and reduce supply voltage so as to just meet the deadlines. • PADRAM: when there are no memory accesses pending, transition memory chip into lower power state • Intuition: DVS will affect the length of memory idle gaps
Back of the Envelope Xscale range – 50MHz, .65V, 15mW to 1GHz, 1.75V, 2.2W Fully active mem – 300mWnap – 30mW w. 60ns extra latency E = P * t What information do you need to know?
Power Aware Memory Read/Write Transaction RDRAM Power States Active 300mW +6000 ns +6 ns Power Down 3mW Standby 180mW +60 ns Nap 30mW
What can go wrong at this stage? • Never understanding the problem well enough to crisply articulate the goals / questions / hypothesis. • Getting invested in some solution before making sure a real problem exists. Getting invested in any desired result. Not being unbiased enough to follow proper methodology. • Any biases should be working against yourself. • Fishing expeditions (groping around forever). • Having no goals but building apparatus for it 1st. • Swiss Army knife of simulators?
Example • Hypthesis:the best speed/voltage choice for DVS to minimize energy consumption when idle memory can power down is the lowest speed that is able to meet deadline (i.e., the same conclusion made by most DVS studies without memory).
A Systematic Approach • Understand the problem, frame the questions, articulate the goals.A problem well-stated is half-solved. • Must remain objective • Be able to answer “why” as well as “what” • Select metrics that will help answer the questions. • Identify the parameters that affect behavior • System parameters (e.g., HW config) • Workload parameters (e.g., user request patterns)
Experimental Lifecycle Vague idea • 2. Select metrics that will help answer the questions. • 3. Identify the parameters that affect behavior • System parameters • Workload parameters Initialobservations “groping around” experiences Hypothesis Data, analysis, interpretation Model Results & finalPresentation Experiment
An Example System under test: CPU and memory. Metrics: total energy used by CPU + memory, CPU energy, memory energy, execution time
Parameters Affecting Behavior Hardware parameters • CPU voltage/speed settings, • Processor model (e.g. in-order, out-of-order, issue width) • Cache organization • Number of memory chips and data layout across them • Memory power state transitioning policy • Threshold values • Power levels of power states • Transitioning times in & out of power states. Workload: periods, miss ratio, memory access pattern
What can go wrong at this stage? • Wrong metrics (they don’t address the questions at hand)What everyone else uses. Easy to get. • Not clear about where the “system under test” boundaries are. • Unrepresentative workload. Not predictive of real usage. Just what everyone else uses (adopted blindly) – or NOT what anyone else uses (no comparison possible) • Overlooking significant parameters that affect the behavior of the system.
A Systematic Approach • Decide which parameters to study (vary). • Select technique: • Measurement of prototype implementationHow invasive? Can we quantify interference of monitoring? Can we directly measure what we want? • Simulation – how detailed? Validated against what? • Repeatability • Select workload • Representative? • Community acceptance • Availability
Experimental Lifecycle Vague idea Initialobservations “groping around” experiences Hypothesis Data, analysis, interpretation Model Results & finalPresentation • Decide which parameters to vary • Select technique • Select workload Experiment
An Example • Choice of workload: MediaBench applications(later iterations will use a synthetic benchmark as well in which miss ratio can be varied) • Technique: simulation using SimpleScalar augmented with RDRAM memory, PowerAnalyzer • Factors to study– CPU speed/voltage • Comparing nap memory policy with base case
What can go wrong at this stage? • Choosing the wrong values for parameters you aren’t going to vary.Not considering the effect of other values (sensitivity analysis) • Not choosing to study the parameters that matter most – factors • Wrong technique • Wrong level of detail
A Systematic Approach • Run experiments • How many trials? How many combinations of parameter settings? • Sensitivity analysis on other parameter values. • Analyze and interpret data • Statistics, dealing with variability, outliers • Data presentation • Where does it lead us next? • New hypotheses, new questions, a new round of experiments
Experimental Lifecycle Vague idea Initialobservations “groping around” experiences • Run experiments • Analyze and interpret data • Data presentation Hypothesis Data, analysis, interpretation Model Results & finalPresentation Experiment
What can go wrong at this stage? • One trial – data from a single run when variation can arise. • Multiple runs – reporting average but not variability • Tricks of statistics • No interpretation of what the results mean. • Ignoring errors and outliers • Overgeneralizing conclusions – omitting assumptions and limitations of study.
A Systematic Approach • Run experiments • How many trials? How many combinations of parameter settings? • Sensitivity analysis on other parameter values. • Analyze and interpret data • Statistics, dealing with variability, outliers • Data presentation • Where does it lead us next? • New hypotheses, new questions, a new round of experiments
Experimental Lifecycle Vague idea Initialobservations “groping around” experiences Hypothesis 10. What next? Data, analysis, interpretation Model Results & finalPresentation Experiment
An Example • New Hypothesis: There is one “best” controller policy across all different speed settings • Vary miss ratio of synthetic benchmark • Vary speed/voltage
Metrics • Criteria to compare performance • Quantifiable, measurable • Relevant to goals • Complete set reflects all possible outcomes: • Successful – responsiveness, productivity rate (throughput), resource utilization • Unsuccessful – availability (probability of failure mode) or mean time to failure • Error – reliability (probability of error class) or mean time between errors
Response time Throughput (requests per unit of time) MIPS, bps, TPS Common Performance Metrics (Successful Operation) Service completes Service begins Response back Request starts Request ends Request starts nominal capacity thruput reaction think knee usablecapacity response time load
Discussion Next Time:Destination Initial Hypothesis Vague idea Initialobservations “groping around” experiences Pre-proposal 1:Sketch out what information you would need to collect (or have already gathered) in a “groping around” phase to get from a vague idea to the hypothesis stage for your planned project Hypothesis