Download
1 / 25
260 likes | 390 Vues
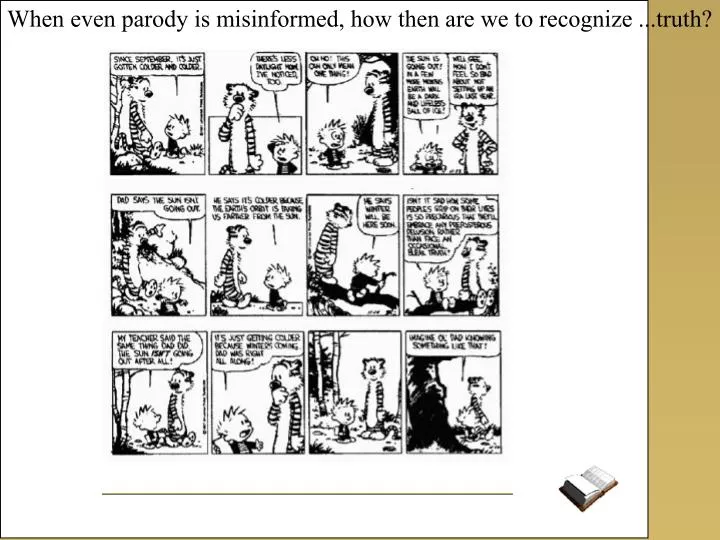
When even parody is misinformed, how then are we to recognize ...truth?. Alternative Conceptions in Science and Science Teaching Efficacy: Remediating Pre-service Teachers’ Alternative Conceptions and their effect on Science Teaching Efficacy and Reflective Judgment.

E N D
When even parody is misinformed, how then are we to recognize ...truth?
Alternative Conceptions in Science and Science Teaching Efficacy: Remediating Pre-service Teachers’ Alternative Conceptions and their effect on Science Teaching Efficacy and Reflective Judgment. The purpose of this study was to assess the effect of a Science Methods course experience on pre-service teachers’ personal science teaching efficacy. Additionally, attitudes toward science and constructivist learning environments were measured, and possible correlation of these attributes to the Reflective Judgment model of King and Kitchener (1990) were investigated. ...
Statement of Hypotheses quantitative analysis <findings> Alternative Conceptions in Science: There are significant differences in the number of alternative science conceptions held between the two primary cohort groups, both at the beginning of the study and at the end (Moscow class and Coeur d’Alene class). There is a significant difference in the number of alternative conceptions in science among age-ranked participants within and across the two cohort groups. Alternative Conceptions and Science Teaching Efficacy: There are significant differences among participants holding few (0 – 6) alternative science conceptions and their cohorts with higher numbers of alternative conceptions ( >7) with respect to personal science teaching efficacy. Remediating misconceptions in a constructivist, collaborative setting focused on National Science Education Standards contributes to changing Science Teaching Efficacy. Alternative Conceptions, Science Teaching Efficacy and Reflective Judgment: There is significant correlation among measures of science “misconceptions”, teaching efficacy attitudes, openness to constructivist learning environments and reflective judgment. Those students scoring highest in Reflective Judgment are also those identified as most efficacious in personal science teaching, having remedied a larger number of their own alternative conceptions in science, and being more open to constructivist learning environments. It was hypothesized that a heavy emphasis on standards, constructivist approaches to teaching and learning, and the process of dispelling common misconceptions would promote participants’ efficacy in science and science teaching as they learned to de-construct currently held beliefs and reformulate more correct personal understandings. <yes> <yes> <yes> <yes> <not entirely!> <not entirely!>
Classic naive theories lead to “misconceptions” What causes the seasons? What causes the “phases” of the moon? What are “basic states” of matter? Can you see, eventually, in a totally dark room? “...what does a cloud weigh?” Research shows that learner alternative conceptions must be addressed and fully explored in order to set the stage for development of successful (defensible) interpretations. Piaget, 1926; Piaget, 1952; Piaget, 1954; Piaget, 1970; Dewey, 1933; Dewey, 1938, Rokeach, 1960, 1968; Abelson, 1979; Mead, 1982; Nisbett & Ross, 1980; Posner, Strike, Hewson, & Gertzog, 1982; Pajares, 1992; Wandersee, Mintzes, and Novak,1994; Schoon and Boone, 1998.
Instruments used in this study quantitative analysis Alternative Conceptions in Science survey (ACS), Schoon and Boone’s (1998). Science Teaching Efficacy Belief Instrument (STEBI), Enochs and Riggs (1990). Constructivist Learning Environments Survey (CLES), Taylor and Fraser’s (1998). Reasoning about Current Issues Test (RCIT), King and Kitchener’s (1994). Additional information: student demographic surveys (science background, favorite subjects, and comfort levels in teaching various topics, as well as gender, age and recent science experiences).
Self-Efficacy quantitative analysis The construct of self-efficacy was introduced by Bandura in 1977 in his publication "Self-Efficacy: Toward a Unifying Theory of Behavioral Change."Self-efficacy is a measure of beliefs that are judgements about how well one can organize and execute courses of action required to deal with prospective situations (Bandura, 1981). Self-efficacy in science and science teaching can be measured reliably by Enochs and Riggs’ (1990) Science Teaching Efficacy Belief Instrument (STEBI). The STEBI is a Likert-Scale instrument used in the pre- and post-testing of preservice teachers’ science and science teaching self-efficacy.
Constructivist Learning Environments A theory about the nature of reality and how people understand the world around them. What learners hold to be “true” will be based on what mentally works for them, what makes sense within their conceptual framework. Constructivism: “Constructed” new knowledge builds upon prior knowledge, intuition, reasoned experience and collaborative idea making. (von Glaserfeld, 1989, and Lorsback and Tobin,1992, among others)
Models of Epistemic Development Models of epistemological development are necessarily arbitrary and at best provide only silhouettes of thinking and behavior. Their value lies in structuring our understanding of cognitive development, and guiding research by simplifying the process of identifying criteria for study and isolating aspects of interest to the researcher. Models are commonly structured as a series of incremental stages in which an individual’s beliefs about the nature and justification of knowledge grow increasingly more sophisticated. Piaget (1920s - 1970s)Genetic Epistemology Intellectual Development Stages: Sensorimotor, Preoperational, Concrete Operational, Formal Operational Cognitive Development Stages: Maturation, Experience, Interaction, Equilibrium. Schema: assimilation, accretion; accommodation, tuning, discrimination, restructuring, creation.
Models of Epistemic Development continued… Perry (1968)Intellectual & Moral Development Model 9 stage developmental scale: Polar view: we-right v. others-wrong Diversity of opinion, uncertainty considered with further research. Diversity and uncertainty as legitimate but alternative viewpoints temporary. Diversity and uncertainty as legitimate, alternative viewpoints: forcing choice of status quo thinking or progression to contextualized relativistic reasoning. All knowledge and values as contextual and relativistic. Commitment to relativism: choice made, qualified, contextualized. (3 additional stages) Accepting implications of commitment. Belenky, Clinchy, Goldberger, & Tarule(1960-70s) Women’s Ways of Knowing 5 Categories: Silence Received Knowledge Subjective Knowledge Procedural Knowledge Constructed Knowledge Marcia Baxter-Magolda(1992) Epistemological Reflection Model 4 stages: Absolute Knowing Transitional Knowing Independent Knowing Contextual Knowing
Models of Epistemic Development continued… King & Kitchener’s Reflective Judgment Model Beginning in the early 1970s Patricia King and Karen Kitchener sought exclusively an epistemic (not moral) developmental characterization in cognition. Their Reflective Judgment (RJ) model is based upon how knowers perceive and solve ill-structured problems, those questions whose answers depend on a contextual perspective. The RJ model stages describe a progression in sophistication of views of knowledge, origins of knowledge, and certainty of knowledge, as well as concepts of justification. The basic Reflective Judgment model categories are (in order of increasing sophistication) include: Pre-reflective Thinking, Quasi-reflective Thinking, and Reflective Thinking.
Critical Reflective Thinking & the Reflective Judgment Model Dewey (1938) stressed that in teaching problem solving, students “must engage in reflective thinking to evaluate the potential solutions to problems in light of existing information... Further, Dewey said, “uncertainty is a characteristic of the search for knowledge”… it is a process of constructing ever more plausible solutions to ill-structured challenges. Bandura (1986) considered self-reflection the most uniquely human capability, for through this form of self-referent thought people evaluate and alter their own thinking and behavior. King and Kitchener (1990) suggest that critical thinking and reflective thinking during science inquiry hinge upon recognizing the structure of problems and potential solutions. Well-structured problems including puzzles and mental exercises, have complete and definite solutions, ... Ill-structured problems have low degrees of completeness, low certainty in solutions proposed, require alternative scenario thinking, are context-sensitive, and “best solutions” are identified through a process of evaluating logical strengths to arguments, evidence, and application.
Analysis and Results (quantitative research results) From an analysis of pre- and post-treatment survey results, it was found that the two sections of the Science Methods class differed significantly in the degree to which students were able to remediate common science misconceptions, and also the extents to which their personal science teaching efficacy changed as a result of the course experience. The primary analytical procedures employed were Multiple Regression and Analysis of Variance. Caveats are mentioned throughout the descriptions of the results and interpretations made therefrom, the most serious of which are the limitations imposed on interpretation and generalizability of findings due to small sample size. quantitative analysis
Classic naive theories & alternative conceptions: (Schoon & Boone, 1998) quantitative analysis
quantitative analysis Alternative Conceptions: pre- and post-treatment t-tests of independence were run on Alternative Conceptions in Science in order to evaluate the significance of differences in pre- and post-treatment scores for the entire sample. Test of independence for pre- and post-treatment on Alternative Conceptions in Science. t-tests for Paired Samples ACS 2-tail Variable Mean SD SE of Mean # pairs Corr Sig ACS_POS .7297 .157 .021 58 .605 .000 ACS_PRE .5990 .124 .016 Paired Differences Mean SD SE of Mean t-value df 2-tail Sig .1307 .128 .017 7.77 57 .000 95% CI (.097, .164)
Hypothesis 1b: There is a significant difference in the number of alternative conceptions in science among age-ranked participants within and across the two cohort groups. • Multiple Regression of ACS with SCK, ST, CLES-rel, CLES-un, AgeRank, and Scibk college and highschool science background as independent variables. • From coefficients for the independent variables listed in column B in the table below.The estimated regression equation can be written as follows: • Y = 0.421 +0.3100xSCK + 0.043xAgeRank + 0.006xSciBk(coll) + 0.004xSciBk(hsch) - 0.003xCLESper/rel – 0.040xCLESunc –0.049xST • Regression Coefficients for ACS • Variable B SE B 95% Confdnce Intrvl B Beta T Sig T • CONTENT .310015 .116917 .075179 .544850 .358258 2.652 .0107 • STUDTYPE -.049322 .069441 -.188799 .090156 -.185696 -.710 .4808 • CLSRELPR -.003936 .022634 -.049398 .041526 -.022798 -.174 .8626 • CLSUNPR -.040121 .020748 -.081795 .001553 -.253329 -1.934 .0588 • AGERANK .043661 .024562 -.005673 .092994 .485826 1.778 .0816 • COLSCIBK .006921 .011073 -.015320 .029161 .079865 .625 .5348 • HSSCIBK .004662 .006573 -.008539 .017864 .093964 .709 .4814 • (Constant .421206 .128238 .163632 .678781 3.285 .0019 • From the coefficient for SCK (Science Content Knowledge) shows the highest positive value and indicates that: • ACS scores increase by 0.310 for every change of 1 in the value of the SCK score. quantitative analysis • The ANOVA indicates a significant main effect. • Analysis of Variance for ACS. • DF Sum of Squares Mean Square F Sig F • Regression 7 .24800 .03543 2.82186 .0147 • Residual 50 .62774 .01255
Alternative Conceptions and Science Teaching Efficacy Hypotheses continued... quantitative analysis • Hypothesis 2b: Remediating misconceptions in a constructivist, collaborative setting focused on National Science Education Standards contributes to changing Science Teaching Efficacy. • Personal Science Teaching Efficacy Analysis (PSTE: dependent variable) • Independent variables= ACS, CLES-rel, CLES-un, ATS, SCK, AgeRank, Gender, and ST. • The estimated regression equation can be written as follows: • Y = 0.594 + 1.190xSCK + 0.829xACS + 0.276xCLESper + 0.259xATS + 0.151xCLESun • + 0.150xAgeRank –0.205xGender – 0.231xST • Regression Coefficients • Variable B SE B % Confdnce Intrvl B Beta T Sig T • CLESper/rel .276626 .104768 .066087 .487164 .318621 2.640 .0111 • CLESuncert .151548 .085132 -.019530 .322627 .215799 1.780 .0813 • ATS .259403 .230166 -.203134 .721940 .147090 1.127 .2652 • SCK 1.190473 .519989 .145517 2.235429 .276101 2.289 .0264 • Gender -.205062 .192321 -.591546 .181422 -.139668 -1.066 .2915 • ST -.231255 .288475 -.810967 .348458 -.174739 -.802 .4266 • AgeRank .150034 .098721 -.048353 .348421 .335055 1.520 .1350 • ACS .829949 .458676 -.091795 1.751694 .210361 1.809 .0765 • (Constant) .594539 .897827 -1.209711 2.398789 .662 .5109 • PSTE scores increase by 1.190 for every change of 1 in the value of SCK. • Other coefficients show relationships that indicate far less linear relationship: ACS (coeff= 0.829), CLESper/rel (coeff=0.276), Attitude (coeff= 0.259), CLES science uncertainty (coeff=0.151), and AgeRank (coeff=0.150). Two of the independent variables show an inverse linear relation: coeff= -0.205 for Gender, and coeff= -0.231 for Student Type (ST).
Reflective Judgment results... quantitative analysis
Reflective Judgment results... quantitative analysis <outliers: participants in prior “constructivist” and reflective Integrated Science course.>
“Optimizing the Instructional Moment” qualitative analysis In this “methods space” the teacher - student relationship can be envisioned as a flexible link connecting expert and learner occupants that are in constant motion (tension) drifting around in the medium of inquiry. “Every learner in every learning environment interfaces with the environment at his sensory receptors”. (Keegan, M., 1993).
Qualitative Research Results qualitative analysis The inverse relationship between teacher and learner volition (willful intent) and activity through the four methods. The trends are curved with increasingly dramatic relative volition from stage to stage across the methods spectrum.. After Keegan (1993)
qualitative analysis
qualitative analysis Are presevice teachers ready for autonomous learning? [student reflection: March, 1998] This class is a waste of time, I haven’t been taught anything! I’ve had to learn everything myself. [student reflection: March 11, 1998] I don't rate myself very highly using this method.... I've had to rely more on my personal motivation for learning and pushing myself to get assignments done on my own time. It's been a difficult adjustment. I'm used to having the entire semester laid out in simple terms where you only have 3 or 4 tests and maybe a paper. This class is definently different!
qualitative analysis [student reflection: February 20, 1998] I've never had a class like this so it's hard to get used to. It seems like each instructor gives a different answer to our questions. The class is very chaotic and I get frusterated with not knowing exactly what's going on. I really like structer (sp)! I learn better when I feel like I know whats going on. I liked the deforestation-sphere activity looking things up. I learned a lot about deforestation and its effects on the environment.
[student reflections....] I think much differently about science in general than I did before taking this course. This course has really provided me the insight that I don't need to know everything about science to teach it effectively. I feel that my confidence level alone is much higher after taking this course, not to mention how I think that science is effectively taught. For me, science was always a lecture, do some random activity, fill out a worksheet, and then turn it in. These types of activities always left me thinking that if I got a bad grade, I'd obviously gotten the wrong answer, so I began to feel that I wasn't good at science because I didn't have the right answer. Now I think science isn't about right or wrong answers, but the process you took to get there. It isn't about doing random experiments. I like the idea of having students come up with their own experiment for something. The more students are allowed to explore their processes of finding information out for themselves, the more independent that student will be. The teacher won't be such a needed figure in my classroom to tell the students exactly what they should do. The students will figure that out for themselves, with me in the process to facilitate their learning, should they need it. qualitative analysis