Download
1 / 19
190 likes | 282 Vues
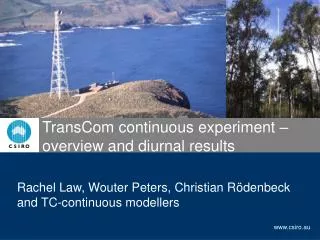
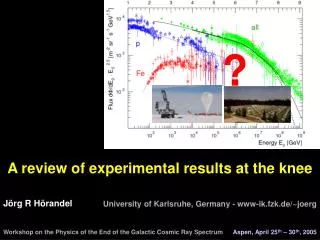
The comparison of TransCom continuous experimental results at upper troposphere. Takashi MAKI, Hidekazu MATSUEDA and TransCom Continuous modelers. Motivation. To improve tracer transport model, we need to know transport processes in detail.

E N D
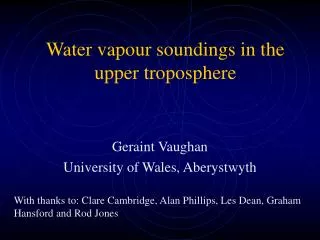
The comparison of TransCom continuous experimental results at upper troposphere Takashi MAKI, Hidekazu MATSUEDA and TransCom Continuous modelers
Motivation To improve tracer transport model, we need to know transport processes in detail. Vertical transport process could affect tracer distributions (global, regional). Aircraft observational data are good indicator for vertical transport. We have tried to use aircraft observational data to check vertical transport.
Comparison method Experiment : TransCom Continuous (Rachel, et al, 2005) Period : 2002 – 2003 Observation: Tokyo - Sydney aircraft (Matsueda, et al, 2002) Model output: hourly snap shot (at observational time) Indicators : Suitable Offset : Standard deviation of (model – observation) in the suitable offset
Observational Data Days from 1 Jan. 2002 Difference from Jan. 2003, equator
TransCom results Fossil 98 + Takahashi Ocean (2002) + SiB hourly conc. 7 Jan 2003 values are subtracted from each result.
TransCom results (2) Add suitable (minimize standard deviation of (model – observation )) offset.
TransCom results (3) Add suitable (minimize standard deviation of (model – observation )) offset.
? TransCom Models Results less mixed Outlier?? Do we need vertically less mixed model?? Fit to observations
Sensitivity Test We prepare On-line (directly coupled with GCM) transport model with several vertical coordinates. We adopt surface fluxes by TransCom continuous experiment and compare CO2 concentrations. We assimilate (nudging) re-analysis meteorological field to drive On-line transport model. We also prepare a tuned off-line CDTM (less mixed in PBL and more mixed in troposphere).
Transport Model (GCM) Model Name : MJ-98 (Shibata et al.) Dynamics : Global spectral model Resolution : T42L45 Time step : 300s Convection : Arakawa-Schubert Radiation : Shibata Land surface : SiB Diffusion : Mellor-Yamada (L2) Gravity wave drag : Iwasaki
Transport Model (CDTM) Name : CDTM (Sasaki et al.) Resolution : Same as GCM (T42L45) (changed from 2.5 x 2.5 deg. L32) Time step : Same as GCM (300s) Transport : 3D Semi-Lagrange (changed from 2D Semi-Lagrange) Diffusion : Convection, Turbulent, Shallow convection Mass fixer : Simple mass fixer Tracers : Same as Continuous exp. Current stage, we simply introduce our CDTM vertical mixing into MJ-98.
Off-line VS On-line Main difference is vertical advection.
Meteorological field We adopt Japanese 25-year Reanalysis Project (JRA-25) to assimilation. We could use precise and uniform quality meteorological field (same as Off-line CDTM).
Vertical Coordinate We have tested 4 vertical coordinates. L : Operational forecast model based H : Stratospheric ozone model based C : CDTM based (attend TransCom) C2 : CDTM based (divide lowest layer)
Experimental Results less mixed On-line models can reduce the offset. Vertical coordinates do not affect the offset. Vertical mixing tune is useful in hourly case. Fit to observations
Summary We have compared our experimental results against aircraft data. The result shows our models could almost reproduce upper troposphere CO2 concentrations. We have prepared On-line transport model nudging with re-analysis wind. The On-line model could reduce the standard deviation (and the offset) this means that the model has good potential to tracer transport. For hourly biosphere flux, turning of vertical mixing process could reproduce upper observational data well.
Future Plan At this stage, we simply introduce our transport model into GCM. In On-line model, we could use several GCM parameters without spatial and temporal interpolation (cumulus convection, planetary boundary layer diffusion, etc) We have a plan to attend Upper-air and satellite inter-comparison project with these models to understand vertical transport process in detail.
References JRA-25 : http://jra.kishou.go.jp/index_en.html Law, R., W. Peters, C. Rödenbeck 2005: Protocol for TransCom continuous data experiment. Matsueda, H., H. Y. Inoue, and M. Ishii 2002: Aircraft observation of carbon dioxide at 8-13 km altitude over the western Pacific from 1993 to 1999. Tellus, 54B, 1-21. Sasaki. T, T. Maki, S. Oohashi and K. Akagi, 2003: Optimal sampling network and availability of data acquired at inland sites. GLOBAL ATMOSPHERIC WATCH REPORT SERIES, No. 148, 77-79. Shibata, K., H. Yoshimura, M. Ohizumi, M. Hosaka and M. Sugi, 1999: A simulation of troposphere, stratosphere and mesosphere with MRI/JMA98 GCM. Papers in Meteorology and Geophysics., 50, 15-53.