Download
1 / 10
100 likes | 190 Vues
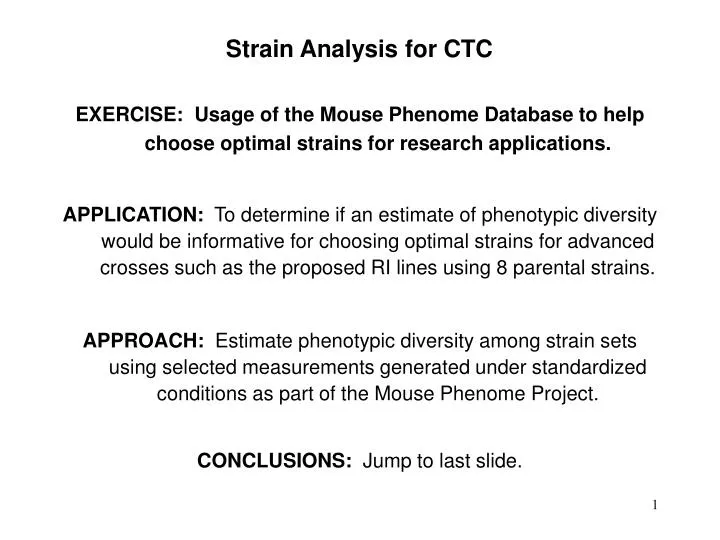
Strain Analysis for CTC. EXERCISE: Usage of the Mouse Phenome Database to help choose optimal strains for research applications.

E N D
Strain Analysis for CTC EXERCISE: Usage of the Mouse Phenome Database to help choose optimal strains for research applications. APPLICATION: To determine if an estimate of phenotypic diversity would be informative for choosing optimal strains for advanced crosses such as the proposed RI lines using 8 parental strains. APPROACH: Estimate phenotypic diversity among strain sets using selected measurements generated under standardized conditions as part of the Mouse Phenome Project. CONCLUSIONS: Jump to last slide.
Strain Analysis for CTC Four strain sets (slide 3) were compared for phenotypic diversity based on MPD data. Z-scores were used to estimate the total diversity of each group. Slide 4 shows data from one measurement to illustrate this approach (refer to steps below). • Nine unrelated measurements (slide 5) were chosen for analysis (measurements are independent based on correlations between pair-wise measurements, cc less than +/- 0.36; slide 6). • Strain Z-scores were collected for each measurement and increased by 5 to bring all values into positive space (denoted Z-score*). • The standard deviation of Z-scores* was calculated for each measurement per strain set (shown in slide 7A-left and with measurement details in slide 7B). • Z-score* standard deviations were added to give an estimate of the relative phenotypic diversity across strain sets (slide 7A-right). • The standard deviation of Z-scores* was calculated for each strain as an indicator of strain performance (diversity) across all measurements to identify the most phenotypically diverse strains in the 4 strain sets (slide 8). • Two additional strain sets were defined and compared to the original 4 strain sets to determine if a more powerful strain set could be assembled from the pool of 15 strains (slide 9).
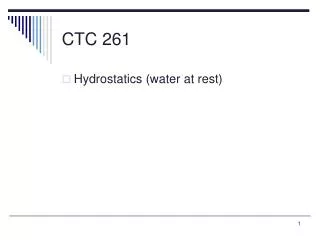
one measurement; strains in alphabetical order This approach to estimating overall phenotypic diversity of multiple sets of strains is dependent on the following: • strains of each set must have been measured as part of the same test (cannot mix data from other measurements), • the total number of strains tested must be greater than the number of strains in each set, • each set must contain the same number of strains Strain sets do not have to be exclusive (a strain may belong to multiple groups or may be exclusive to one group) 1 4 2 3 Diversity ranking in decreasing order
BOULDER HS C57BL/6J A/J AKR/J BALB/cJ C3H/HeJ DBA/2J I/LnJ RIII/SJ NEWPORT HS C57BL/6J A/J AKR/J BALB/cJ C3H/HeJ CBA/J DBA/2J LP/J STRAIN SETS PHENOME A C57BL/6J A/J BALB/cJ C3H/HeJ DBA/2J FVB/NJ SJL/J 129S1/SvImJ SELECTED C57BL/6J A/J BALB/cJ BTBR T+ tf/tf CZECHII/EI DBA/2J PL/J 129S1/SvImJ Boulder HS, Newport HS, and Phenome A strains have been defined. A fourth strain set was ‘Selected’ based on strains that have been sequenced and strains expected to be outliers for selected measurements. MPD data from the closest related extant strains were used for the Boulder and Newport HS strain sets.
SELECTED MEASUREMENTS See MPD website for detailed information about each measurement. Enter measurement number in search box on homepage, e.g., ‘meas6214’ no spaces. http://www.jax.org/phenome
A B
mean, std Diversity ranking 4 1 5 7 6 8 3 2 Strain diversity is indicated by the standard deviation of Z-scores*.
Slide 8 shows the most variable strains according to the standard deviation of Z-scores*. They are (in order of decreasing variability): BTBR T+ tf/tf, SJL/J, PL/J, AKR/J, CBA/J, I/LnJ, CZECHII/Ei, LP/J (none of these have been sequenced). The top 4 most variable strains together with the 4 strains that have been sequenced produce a strain set very similar in diversity to the ‘Selected’ strain set. A strain set composed of the eight most variable strains (above) increases the overall phenotypic diversity by about one-tenth of one standard deviation per measurement. BTBR T+ tf/tf SJL/J PL/J AKR/J C57BL6J A/J DBA/2J 129S1/SvImJ BTBR T+ tf/tf SJL/J PL/J AKR/J CBA/J I/LnJ CZECHII/Ei LP/J
Strain Analysis for CTC Conclusions Phenotypic diversity of the four strain sets differs when comparing individual measurements, but overall diversity is quite similar when comparing across multiple measurements (compare slides 3, 7, 9). These results suggest that some strain sets may perform better for particular tests but that any of strain sets would be suitable for a wide range of phenotyping tests. We were unable to select a set of 8 strains (from the pool of 15 strains) that significantly exceeded the phenotypic diversity of the original 4 strain sets (slide 9). These results suggest that any reasonably chosen set of strains would be equitable in overall phenotypic diversity and that other criteria should be considered when choosing strains, such as the availability of genomic sequence, genotypic data, and other community resources.