Download
1 / 18
180 likes | 264 Vues
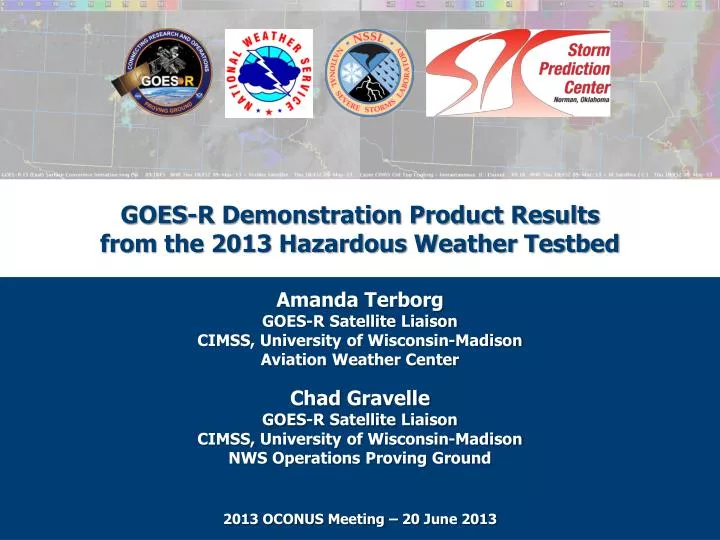
GOES-R Demonstration Product Results from the 2013 Hazardous Weather Testbed. Amanda Terborg GOES-R Satellite Liaison CIMSS, University of Wisconsin-Madison Aviation Weather Center Chad Gravelle GOES-R Satellite Liaison CIMSS, University of Wisconsin-Madison

E N D
GOES-R Demonstration Product Results from the 2013 Hazardous Weather Testbed Amanda Terborg GOES-R Satellite Liaison CIMSS, University of Wisconsin-Madison Aviation Weather Center Chad Gravelle GOES-R Satellite Liaison CIMSS, University of Wisconsin-Madison NWS Operations Proving Ground 2013 OCONUS Meeting – 20 June 2013
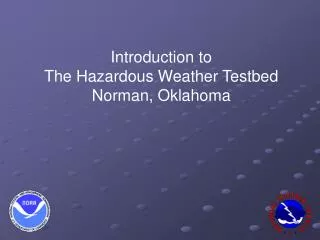
What is the Hazardous Weather Testbed? • Experimental Warning Program aims to improve the prediction of severe convective weather at the “warning scale” (0-2 hours). • In 2013 EWP took place over a three week period (May 6th-24th) during which 18 NWS forecasters and 9 visiting scientists participated.
2013 GOES-R Demonstration Products Within HWT • WRF Simulated Cloud and Moisture Forecasts • NearCasting Model • GOES Sounder RGB Airmass Imagery • Convective Initiation • Cloud-Top Cooling • PGLM Products
2013 GOES-R Demonstration Product Training • Training for the products was completed before arriving at HWT. • HWT participants were instructed to complete self-paced Articulate presentations for each GOES-R product (excluding GOES Sounder RGB Airmass Imagery). • Participants then utilized Job Sheets for a WES Archive Case that incorporated the GOES-R products (including GOES Sounder RGB Airmass Imagery). • For the most part, HWT participants felt the training was sufficient before arriving at HWT.
2013 GOES-R Demonstration Product Training What additional training material or information would you have liked to be provided for any of the products you have seen this week? “The training materials were excellent. Quick tip sheets indicating where the products are in AWIPS2 are very useful when testing.” “I would suggest more training on the RGB airmass satellite product.” “More practice with the PGLM moving trace tool would have been nice.” “I think the overall training was good. A one-stop shop of objectives would have been nice to have in front of my face rather than them scattered amongst the various papers given to us in training.”
WRF Simulated Cloud and Moisture Forecasts Simulated 22-h Forecast Observed IR Imagery “Overall, the simulated IR image did a great job capturing colder cloud tops from convection in west Texas as well as isolated convection over New Mexico. In addition, warmer cloud tops across south Texas were handled well. This product may be helpful for importing into GFE/IFPS for forecast updates as well as short range (3-6 hr) public and aviation forecasts.”
WRF Simulated Cloud and Moisture Forecasts How did you use the simulated satellite data? “We used the NSSL WRF to identify when convection would form and how the convection would behave.” “To get a quick idea of the "big picture" of where storms would form.” “I used it to confirm areas where models may have been under or overestimating CAPE by comparing cloud cover between the simulated and observed imagery. Additionally, I used it for CI purposes.” “The satellite forecasts were used to determine convective initiation and convection locations. They were used to increase or decrease forecast confidence.”
NearCasting Model Visible Imagery at 2245 UTC 8-h NearCastThte Difference Forecast “This NearCast forecast shows a very unstable environment (valid at 0630Z) through the night, which should sustain the convective bow as it tracks across Louisiana and Mississippi. The instability and environment actually seems to improve based on this NearCast run.”
NearCasting Model How useful was the NearCast Model? “The NearCast appears to be a valuable tool. The mid and low theta-e difference appears to be the most helpful…especially as a forecast tool and for a guide to NWP accuracy.” “Today the initial storms seemed to form in an area of lower mid level moisture, which may have kept them below severe limits. The theta-e difference/CAPE fields were somewhat useful here.” “Because of high clouds over our area of concern, the NearCast products were essentially blanked out. This made them not particularly useful -- only a little bit useful at the edges of our area.”
GOES Sounder RGB Airmass Imagery RGB Airmass at 1900 UTC RGB Airmass and 500 HGHT at 2000 UTC “These images depicted an area of drier air, most likely associated with a short wave on the back side of a mid/upper low over southwest Oklahoma. This wave seems to be enhancing cloud cooling and convection initiation over west Texas. We will keep a close eye on this feature to see if this wave will allow for explosive convection 22-01UTC near a dryline from near Childress to San Angelo, TX.”
GOES Sounder RGB Airmass Imagery Did the information provided by the Sounder RGB Airmass product influence your warning strategy? “No. There was nothing really highlighted by the Air Mass RGB product that made me focus on an area for potential warnings.” “On the mesoanalysisdesk I primarily used it to look for increasing moisture plumes and any dry air presence.” “The air mass RGB was helpful in identifying large-scale air mass changes, and especially in seeing areas of stratospheric intrusion / dry air aloft / jet streaks. However, it was not necessarily something that I feel could be used as much of an input into individual convective warnings. For watches and mesoscale analysis, it could definitely be of use.”
Convective Initiation CI and Radar at 2046 UTC CI and Radar at 2115 UTC “The GOES -R CI product detected a 60% probability (yellow area) at 2045 UTC. By 2115 UTC, a thunderstorm had developed in this area. This storm strengthened and prompted the issuance of a Severe Thunderstorm Warning by 2205 UTC and baseball hail was reported by this storm at 2212 UTC. The CI product gave about 20-30 minute lead time for storm development.”
Convective Initiation Did the algorithm perform as expected from the provided training; did you have confidence in the product’s identification of CI? “Yes, the algorithm performed rather well across the Great Plains. Many of the areas with 50% or greater chance for CI verified with at least some time of thunderstorm over that given area.” “After the past couple of days, I have had increasing confidence in the identification of CI using the product. Consistent hits of 50-70% seem to precede initiation.” “The algorithm was very overwhelming. There was a lot of convection identified and the screen was quite cluttered. But it performed as expected...I just didnt feel any increase in confidence.”
Cloud-Top Cooling CTC and Visible Imagery at 2200 UTC over Dodge City, KS CWA “At 2202Z, three areas showed strong (< -20) indications on the CTC product. The two areas in Lane and Clark Counties went on to produce severe thunderstorms. However, the smaller area in Haskell County did not end up with severe hail reports. All three of these CTC areas continued for several consecutive time steps.” Lane County Haskell County Clark County
Cloud-Top Cooling Please comment about your perception of the probability of detection/false alarm rate of the UW-CTC algorithm for strong/intense thunderstorms. “The false alarm rate was rather high today as the UW-CTC algorithm indicated moderate growth of storms at times. The environment did not support many severe storms.” “Where CTC was noted today storms went up and quickly became severe. POD was high.” “From my experience today...the CTC algorithm cannot be used as a standalone tool as in some instances the tool missed rapidly developing storms that were very apparent on visible satellite imagery.”
PGLM Products Reflectivity and PGLM Flash Extent Density at 2152 UTC “The strongest updraft this evening showed ramp up of flashes to 40 before coming back down about 10 minutes later to 15 to 25 flashes. Although the storm didn’t reach severe criteria, it was beneficial that the Flash Extent Density updates in 1 minute intervals, which lets the warning forecaster monitor for rapid updraft development between radar volume scans.”
PGLM Products What features and individual PGLM products did you like or did not like? “The flash extent density was the most useful, especially when used with the tracking tool to show the lightning jumps.” “The flash extent density was the best one because its the simplest to use and process in a rapidly developing warning situation.” “I still do not know how to effectively use the Total Lightning Tracking Tool, but would like to.” “I like most of the products, but the lightning trace tool needs some work to become more functional to the forecaster.”
Questions Questions or Comments?