Download
1 / 15
150 likes | 288 Vues
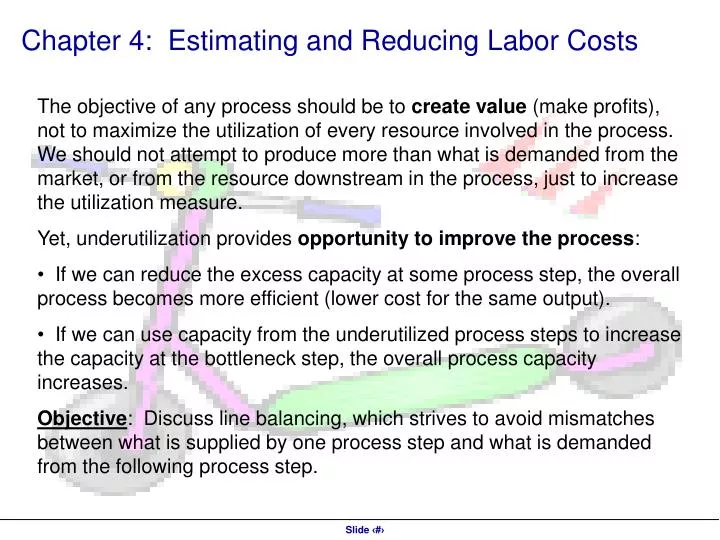
Chapter 4: Estimating and Reducing Labor Costs.

E N D
Chapter 4: Estimating and Reducing Labor Costs • The objective of any process should be to create value (make profits), not to maximize the utilization of every resource involved in the process. We should not attempt to produce more than what is demanded from the market, or from the resource downstream in the process, just to increase the utilization measure. • Yet, underutilization provides opportunity to improve the process: • If we can reduce the excess capacity at some process step, the overall process becomes more efficient (lower cost for the same output). • If we can use capacity from the underutilized process steps to increase the capacity at the bottleneck step, the overall process capacity increases. • Objective: Discuss line balancing, which strives to avoid mismatches between what is supplied by one process step and what is demanded from the following process step.
Weekly demand 1400 1200 1000 800 600 400 200 0 Figure 4.1: The Xootr by Novacruz Figure 4.2. : Lifecycle demand trajectory for Xooters July May April June March August October January November December September 4.1 Analyzing an Assembly Operation It is March 2000 and Novacruz faced a demand of 125 / week.
A Labor Intense Process Components Finished Xootrs Activity 1 Activity 2 Activity 3 Activity Time 13 min/unit Activity Time 11 min/unit Activity Time 8 min/unit Bottleneck = resource with the lowest capacity.
Time to make X units = Time through empty system + 4.2 Time to Process a Quantity X Starting with an Empty Process Worker-paced system: each worker is free to work at his or her own pace; if the first worker finishes before the first worker is ready to accept the parts, then the first worker puts the completed work in the inventory between them. Time through an empty worker-paced process = Sum of the activity times = 13 + 11 + 8 = 32 minutes Machine-paced system: all the steps must work at the same rate. Time through an empty machine-paced process = Number of resources in sequence x Activity time of the bottleneck step = 3 x 13 = 36 minutes
Conveyor Belt Components Finished Xootrs Activity 1 Activity 2 Activity 3 Figure 4.4. : A machine paced process lay-out (Note: conveyor belt is only shown for illustration) Time to make X units = Time through empty system + Exhibit 4.1 • TIME TO PROCESS A QUANITY X STARTING WITH AN EMPTY PROCESS • Find the time it takes the flow unit to go through the empty system: • In worker-paced line, this is the sum of the activity times • In machine-paced line, this is the cycle time x the number of stations • Compute the capacity of the process (see previous methods). Since we are producing X units as fast as we can, we are capacity constrained; thus, • Flow rate = Process capacity • Time to finish X units Q 4.1 a.
4.3 Labor Content and Idle Time Labor content = sum of activity times with labor = 13 min/unit + 11 + 8 = 32 min/unit Cost of direct labor = • To correctly compute the cost of direct labor, we need to look at two measures: • The number of scooters produced per unit of time (the flow rate). • The amount of wages we pay for the same time period. Q 4.1 d.
Exhibit 4.2 • SUMMARY OF LABOR COST CALCULATIONS • Compute the capacity of all resources; the resource with the lowest capacity is the bottleneck (see previous methods) and determines the process capacity. • Compute Flow rate = Min {Available input, Demand, Process Capacity}; • compute Cycle time = • Compute the total wages (across all workers) that are paid per unit of time: • Cost of direct labor = • Compute the idle time of each worker for each unit: • Idle time for worker at resource i = Cycle time x (Number of workers at resource i) – Activity time at resource i • Compute the labor content of the flow unit: this is the sum of all activity times involving direct labor • Add up the idle times across all resources (total idle time); then compute
4.4 Increasing Capacity by Line Balancing • Comparing the utilization levels in table 4.1 reveals a strong imbalance between workers. Imbalances within a process provide micro-level mis-matches between what could be supplied by one step and what is demanded by the following steps. Line balancing is the act of reducing such imbalances. It provides the opportunity to: • Increase the efficiency of the process by better utilizing the various resources • Increase the capacity of the process by reallocating either workers from underutilized resources to the bottleneck or work from the bottleneck to the underutilized resources.
Based on a demand rate of 125 units per week and the assumption that all three workers are a fixed cost for 35 hours per week, line balancing would change neither the flow rate (process is demand-constrained) nor the cost of direct labor (assuming the 35 hours per week are fixed). Consider if demand reaches 200 units per week. Now the process is capacity constrained, specifically by worker 1 who can produce a scooter every 13 minutes while the market demand in one every 10.5 minutes. Worker 1 has a utilization of 100%, yet workers 2 & 3 have idle time: worker 2: utilization is 1/13 / 1/11 = 84.6% worker 3: utilization is 1/13 / 1/8 = 61.5% Cost of direct labor:
Example Line Balancing In an ideal scenario, we could just take the amount of work that goes into building a scooter, which is the direct labor content (32 minutes/unit), and split it up evenly between three workers = 32/3 =10.66 minutes/unit = 640 seconds/unit Moving tasks as shown in figure 4.5 the final activity times are: Worker 1: 623 seconds per unit Worker 2: 602 seconds per unit Worker 3: 665 seconds per unit Average labor utilization = Labor content / (Labor content + Total idle time) = 1,890 / (1,890 + 42 + 63 + 0) = 94.7% New bottleneck is worker 3 resulting in a process capacity of 189.5 units / wk Have reduced the cost of direct labor to $6.65 / unit. Within the scope of this book we only consider cases where the sequence of tasks is given. Also, algorithms and heuristics exist that support line balancing in more complex settings, but that is not the focus for this text and course.
Figure 4.5: Graphical Illustration of Line Balance Line 10 9 8 7 5 4 2 3 1 Cycle Time Before Line Balancing 900 800 12 700 10 11 20 9 1: Prepare cable 2: Move cable 3: Assemble washer 4: Apply fork, threading cable end 5: Assemble Socket head screws 6: Steer pin nut 7: Brake shoe, spring, pivot bolt 8: Insert front wheel 9: Insert axle bolt 10: Tighten axle bolt 11: Tighten brake pivot bolt 12: Assemble handle-cap 13: Assemble brake lever + cable 14: Trim and cap cable 15: Place first rib 16: Insert axles and cleats 17: Insert rear wheel 18: Place second rib and deck 19: Apply grip tape 20: Insert deck fasteners 21: Inspect and wipe-off 22: Apply decal and sticker 23: Insert in bag 24: Assemble carton 25: Insert Xootr and manual 26: Seal carton 600 19 8 500 18 7 26 Activity time [seconds] 400 17 6 25 5 300 16 15 24 4 23 200 22 14 2 3 100 13 1 21 0 Step 1 Step 2 Step 3 Cycle Time After Line Balancing 900 800 700 26 600 17 25 500 24 16 Activity time [seconds] 15 23 400 6 22 14 300 21 13 20 200 12 19 100 18 11 Q 4.2 0 Step 1 Step 2 Step 3
Step 1 Step 2 Step 3 Components Finished Xootrs Step 1 Step 2 Step 3 Step 1 Step 2 Step 3 Step 1 Step 2 Step 3 Four identical lines using the initial process lay-out, 1 worker per step Components Finished Xootrs 4 workers 4 workers 4 workers Step 1 Step 2 Step 3 Finished Xootrs Components 1 2 3 4 5 6 7 8 9 10 11 12 One line, 1 worker per step; inventory between step not shown Figure 4.6. : Three process lay-outs for high volume production 4.5 Scale Up to Higher Volume • Increasing capacity by replicating the line • Increasing capacity by selectively adding workers • Increasing capacity by further specializing tasks
200 180 160 140 120 100 Activity time [seconds] 80 60 40 20 0 Worker 1 2 3 4 5 6 7 8 9 10 11 12 Figure 4.7 : Line balance in a highly specialized line (different colors represent different tasks)
Labor Productivity (Xooters per employee) Largely automated processlikely to be operated inhigh wage region High labor productivity Improvement becauseof line-balancing High capability frontier Trade-off Low labor productivity Low capabilityfrontier Return on assets (sales per $ of equipment) Low High Figure 4.10.: Trade-off between labor productivity and capital investment Largely manual process, Likely to be operated in low wage region