Download
1 / 12
120 likes | 210 Vues
The Pricing of Infrastructure Initial Public Offerings: Evidence from Australia. Bill Dimovski (Deakin University). IPOs and Underpricing. IPOs are common around the world. Returns on average, have been substantial. United States Ibbotson’s 1960-9 11.4% Ritter’s 1974-82 14.8%

E N D
The Pricing of Infrastructure Initial Public Offerings: Evidence from Australia Bill Dimovski (Deakin University)
IPOs and Underpricing • IPOs are common around the world. • Returns on average, have been substantial.
United States Ibbotson’s 1960-9 11.4% Ritter’s 1974-82 14.8% Ibbotson, Sindelar and Ritter (1994 18.4%. Australia How et al 1980-89, 19.74% for industrials and later How reports 107.2% for miners Lee, Taylor and Walter’s 1976-89 16.4% Dimovski and Brooks 1994-99 25.7% underpricing. Dimovski and Brooks (Gold) Mining (2008) 13.3% IPO underpricing around the world
Underpricing around the world • Other Countries [From Ritter (2003)] • Malaysia 104.1% • UK 17.4% • Hong Kong 17.3% • Japan 28.4% • Canada 6.3% • Brazil 78.5 % • China 256.9% • Etc,etc
Rock (1986) - IPOs need to be underpriced to continually attract uninformed investors Leland & Pyle (1977), Welch (1989) underpricing allows for subsequent share issues at a higher price. Benveniste & Spindt (1989) underpricing to attract investors without waiting till listing Tinic 1988 suggests that underpricing is like an insurance -prevents against damages to underwriters/directors Baron 1982 - underwriters discount the shares to sell easier. Ruud (1993) - underwriters price support the issue for a short period Some theoretical explanations of underpricing
Beatty & Ritter (1986) greater uncertainty - greater underpricing Larger issue size; higher issue price; older entity; more reputable underwriter; more reputable accountant/auditor; existence of a banking & venture capital relationships; Uncertainty and underpricing
REIT IPO Research • United States • Wang, Chan and Gau (1992) 1971-88, 87 REITs report a negative 2.82% underpricing return (loss) • Ling and Ryngaert (1997) 1991-94, 85 REITs report a 3.6% underpricing return • Japan • Kutsuna, Dimovski and Brooks (2008) 0.5% • Australia • Dimovski and Brooks(2006) 37 LPT IPOs during 1994 to 1999 - ave. 1.2% but not significantly different from zero. Later Dimovski (2009) sample, 2002 to 2008 REIT IPOs following the introduction of the single responsible entity role. There appears to be slightly higher underpricing.
Infrastructure Research • Peng and Newell (2008) suggest Infra entities have highest returns and highest volatility for 11 years to 2006. • A$55 billion mkt cap • Useful diversification benefits • Neilson (2005) suggests pension funds have A$8 billion invested in infra assets and by 2012 could have up to A$65 billion • Newell and Peng (2008) pension funds globally considering infra investments. • US infra investments also have useful diversification benefits. • Peng and Newell (2007) suggest infra entities have monopoly attributes, high operating margins, predictable earnings and cash flow due to regulation / long term contracts. – Lower uncertainty. • Dewenter and Field (2001) HK – case study 7 infrastructure IPOs 51.1% underpricing to 18.7% overpricing • Yong (2007) current state of IPO research – no studies other than Dewenter and Field (2001)
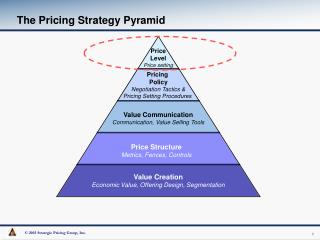
Connect 4 Company Prospectuses database. 30 Australian infrastructure IPOs Feb 1996 to June 2007 Mean underpricing 3.5%, median 0.3%. Not stat different to 0. Ave cap raising A$350m. Smallest $3.5m, largest $1.6bill. Mean money left $3.7m, median $75000. Not diff to 0. Ave time to list 41 days. Ave listing cost was 5.2%. Ave forecast div yields – 6.87%. Data
Models • Day 1 Return = • Size of cap raising, • Market sentiment, • Time to list, • Percentage total cost, • Whether underwritten, • Forecast dividend yield, • (1). • Money left = size of cap raising, market sentiment, time to list, percentage total cost, whether underwritten, forecast dividend yield and (2).
The Results • Table 2 – Underpricing – partitioned underwritten issues - positive and significant relationship between div yield and higher first day returns; perc total cost and higher first day returns. • This suggests that those that forecast higher divs may have higher uncertainty about them and offer a higher return to subscribing investors. Similarly those that pay more in direct costs to list have more uncertainty about their value. • Table 3 –money left - a negative and significant relationship between proceeds and money left. • Larger infrastructure IPOs leave less money meaning they are priced more accurately
Summary • Infrastructure IPOs do not have significantly different to zero first day return or money left characteristics • Not a great deal of uncertainty about their valuation – consistent with Peng and Newell (2007) – predictable cash flows, captive customer base, barriers to entry etc. • It appears that given the substantial amounts of new equity raised in this area of infrastructure IPOs, bankers may be working particularly hard on appropriate valuations.