Download
1 / 16
180 likes | 312 Vues
Photo acoustic spectroscopy of beta amyloids - research overview. Group Meeting February 08. First setup. goal –generating and characterization of pa signal Wavelength – 1550 nm. 1 . OTDR. OTDR pulse width: 100ns-1 μ s. PZT. fiber splitter. Erbium Amplifier. 90%. 10%.

E N D
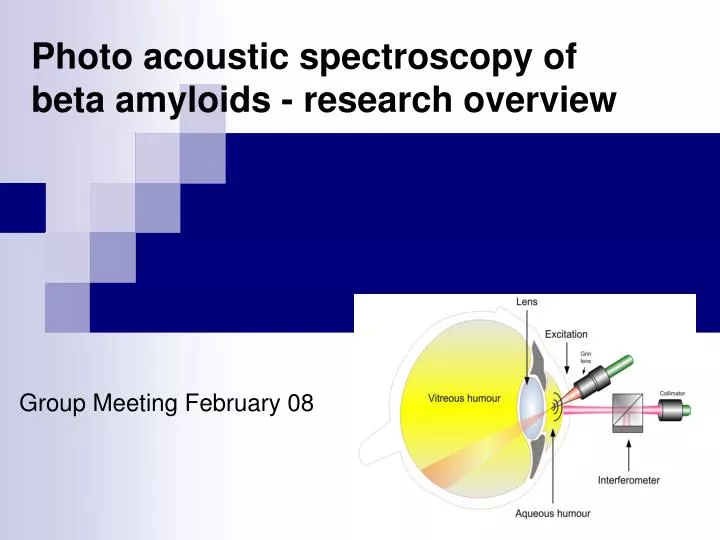
Photo acoustic spectroscopy of beta amyloids - research overview Group Meeting February 08
First setup goal –generating and characterization of pa signal Wavelength – 1550 nm 1. OTDR OTDRpulse width: 100ns-1μs PZT fibersplitter Erbium Amplifier 90% 10% 24V+ Voltage source RF Amplifier detector reference Photo-acoustic signal Scope
2. Tunable Laser Wavelength 1535 -1565 nm Polarization controller TunableLaser Function Generator Modulator Erbium Amplifier x2 PZT 95% fibersplitter 5% 24V+ Voltage source RF Amplifier x3 Reference Signal detector Scope
~5 micro second PZT ~5 micro second
Water: Abs coefficient =11.6 cm^-1 heat capacity = 4.184J cm-3 K-1 Thermal expansion =20710-6/K ethanol: Abs coefficient =5.7 cm^-1 heat capacity = 1.925Jcm-3 K-1 Thermal expansion =75010-6/K
There is a change of 0.28% in sound velocity for a percent change of glucose concentration
1550 Spectrum 200 300 800 2,000 10,000 nm UV visible Near-IR IR peptidic bond(190-250 nm) Over tones (1000-2600) starching vibration of aromatic residues(3.3,6.25,6.6 μm) aromatic residues(~280nm) starching vibration of amide bond (5.88-6.25 μm ) bending vibration of aromatic residues (11.1-14.5 μm)
Technion experiment: Nd:YAG fourth harmonic 266nmlaser: 1.Insulin
2.lysosin 3.Beta amyloid
opo experiment: OPO -optical parametric oscillator
1. insulin Wavelength ~1660nm Zoom in on first peak 2. water
Goals for the short future • improving the sensitivity of the measurements • Defining the concentration and absorption coefficient of solutions by pa measurement • Finding the amyloids over tones spectra , and characterize its pa signal • Examine the ability of performing pa measurements in the MIR • Completing the simulation of the pa signal