Download
1 / 53
540 likes | 739 Vues
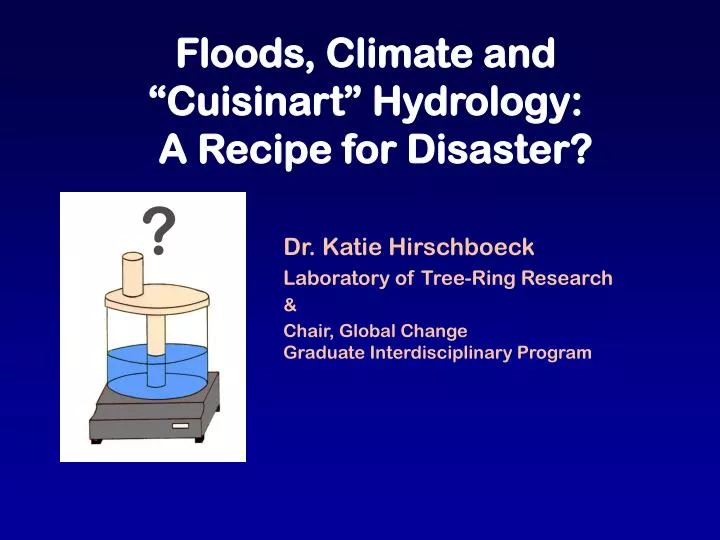
Floods, Climate and “Cuisinart” Hydrology: A Recipe for Disaster?. ?. Dr. Katie Hirschboeck Laboratory of Tree-Ring Research & Chair, Global Change Graduate Interdisciplinary Program. QUESTIONS, QUESTIONS!. WHAT IS A FLOOD? . . . and what is a 100-Year Flood?

E N D
Floods, Climate and “Cuisinart” Hydrology: A Recipe for Disaster? ? Dr. Katie Hirschboeck Laboratory of Tree-Ring Research & Chair, Global ChangeGraduate Interdisciplinary Program
QUESTIONS, QUESTIONS! • WHAT IS A FLOOD? . . . and what is a 100-Year Flood? • WHY DO WE NEED TO WORRY ABOUT THEM? . . . our Arizona rivers are dry most of the time! • WHAT CAUSES FLOODS ?. . . and what difference does this make? • WHAT CAN WE LEARN FROM THE PAST? . . . Are there such things as “Paleofloods”? • WHAT WILL THE FUTURE HOLD?. . . will climate change make floods more extreme? or will they get smaller?
. . . and what the heck is “CUISINART” HYDROLOGY ???? ?
WHAT IS A FLOOD? Definition: “Any relatively high streamflow that overtops the natural or artificial banks of a river” What about steep-sided arroyo channels? These banks aren’t overtopped! Flooding on the Santa Cruz River
WHAT IS A FLOOD? Another: “An overflowing of water onto land that is normally dry” SOURCE: David Rankin video, posted at Flood Control District of Maricopa County http://www.fcd.maricopa.gov/Education/education.aspx
WHAT IS A FLOOD? Yet another: “The state of a river that is at an abnormally high level” The typically dry Santa Cruz River at very low flow vs. Santa Cruz River at Tucson, Arizona The record flood of October 1983!
A rapid rise in flood level during the January 2010 flooding in Arizona Automatic gagingstation Taking a discharge measurement during a flood
streamflow gage Example of an even more rapid rise in flood stage during the January 2010 flooding in Arizona Photos show low flow in Verde River near Clarkdale during July 2009
Why do we need to worry about floods in Arizona when our rivers are dry most of the time? . . . WATCH THIS! SOURCE: David Rankin video, posted at Flood Control District of Maricopa County http://www.fcd.maricopa.gov/Education/education.aspx
Why do we need to worry about floods in Arizona when our rivers are dry most of the time? . . . and this too! SOURCE: David Rankin video, posted at Flood Control District of Maricopa County http://www.fcd.maricopa.gov/Education/education.aspx
More Definitions: “The ANNUAL FLOOD for a given stream is the highest flow recorded at a point on a stream during any particular calendar year or water year.” Annual FloodTime Series Largest peak in each year DISCHARGE(cubic feet per second) WATER YEAR
SO WHAT IS A 100-YEAR FLOOD? Def: “The 100-YEAR FLOOD is a flood event that statistically has a 1 out of 100 (or one percent) chance of being equaled or exceeded on a specific watercourse in any given year.” Flood Insurance Rate Maps are based on the 100-Year Floodplain ( the area that will be inundated by a 100-Year Flood) SOURCE: Pima County Regional Flood Control District http://rfcd.pima.gov
DO WE NEED 100 YEARS OF FLOOD RECORDS TO ESTIMATE IT? Nope, the 100-Year Flood is estimated statistically from the available record:! SOURCE: modified from Jarrett, 1991 after Patton & Baker, 1977
. . . but sometimes there are problems due to “outliers” Pecos River nr Comstock, TX Is this a recipefor disaster? SOURCE: modified from Jarrett, 1991, after Patton & Baker, 1977
Flow Time Series Flow Time Series The flood of October 1983!(WY 1984) A fairly long record with lots of variability . . . . The gage was shut downin 1980
WHAT CAUSES FLOODS ?. . . and what difference does this make? Seasonality of Peak Flooding
FLOOD-CAUSING MECHANISMS Meteorological & climatological flood-producing mechanisms operate at varying temporal and spatial scales
WINTER & SPRING FRONTAL ACTIVITY Schematic showing 3 modes of westerly flow. FLOODING & EL NINO are more likely to be associated with the Meridional Jet or Split Jetpattern Winter flooding on the Rillito in Tucson Roosevelt Dam Jan 1993 Canada del Oro flooding of La Cholla Road Jan 2008
SUMMER CONVECTIVE “Monsoon”THUNDERSTORMS Sabino Canyon flooding July 1999 Rillito July 2006 Typical urban flash flooding in Arizona
ENHANCED PRECIPITATIONFROM EASTERNNORTH PACIFIC TROPICAL STORMS IMPORTANT FLOOD-GENERATING TROPICAL STORMS Tropical Storm Norma & the Labor Day flood of Sep 1970 Tropical Storm Heather Oct 1977 Tropical Storm Octave Oct 1983
http://acwi.gov/hydrology/Frequency/B17bFAQ.html#mixed“Flood magnitudes are determined by many factors, in unpredictable combinations. It is conceptually useful to think of the various factors as "populations" and to think of each year's flood as being the result of random selection of a "population”, followed by random drawing of a particular flood magnitude from the selected population.”
The Standard iid Assumption for FFA The standard approach to Flood Frequency Analysis (FFA) assumes stationarity in the time series & “iid” “ iid ” assumption: independently, identically distributed
Different storm types produce different flood hydrographs: Summer monsoon convective event Synoptic-scale winter event Discharge The type of storm influences the shape of the streamflow hydrograph and the magnitude & persistence of the flood peak Tropical storm or other extreme event Time
Therefore: NEW & USEFUL INFORMATION FOR EVALUTING FLOOD RISK! CLIMATIC CAUSE + FLOODS = It all started with a newspaper ad . . . .
Current practice analyzes floods using “CUISINART”HYDROLOGY! “FLOOD PROCESSOR” With expanded feed tube – for entering all kinds of flood data including steel chopping, slicing & grating blades– for removing unique physical characteristics, climatic information, and outliersplus plastic mixing blade – to mix the populations together
Time-varying variances Both SOURCE: Hirschboeck, 1988 Alternative Conceptual Framework: Time-varying means • Mixed frequency distributions may arise from: • storm types • synoptic patterns • ENSO, etc. teleconnections • multi-decadal circulation regimes
Can we find out more about what drives this history of flooding? Remember the Santa Cruz record? What does it look like when classified hydroclimatically? What kinds of storms produced the biggest floods?
FLOOD HYDROCLIMATOLOGY = classifying each flood in the record according to cause
Historical Flood Many more winter floods!
FLOOD HYDROCLIMATOLOGYis the analysis of flood events within the context of their history of variation - in magnitude, frequency, seasonality - over a relatively long period of time - analyzed within the spatial framework of changing combinations of meteorological causative mechanisms SOURCE: Hirschboeck, 1988
This framework of analysis allows a flood time series to be combined with climatic information . . . To arrive at a mechanistic understandingof long-term flooding variability and the likelihood of different types of floods occurring.
WHAT CAN WE LEARN FROM LARGE FLOODS OF THE PAST? Here’s evidence that a large flood moved this huge boulder to this height on the floodplain: Scar on tree from flood damage can be dated with tree-ring analysis; also reveals the height of the floodwaters Datable flood deposits layers show how many larger floods occurred here
Non-exceedence level Paleoflood stage Threshold level PALEOFLOOD RESEARCH!
1993 Largest paleoflood(A.D. 1010 +- 95 radiocarbon date) FLOOD HYDROCLIMATOLOGY evaluate likely hydroclimatic causes of pre-historic floods Historical Flood
Compilations of paleoflood records combined with gaged records suggest there could be a natural, upper physical limitto the magnitude of floods in a given region --- will this change if the climate changes? Envelope curve for Arizona peak flows
WHAT WILL THE FUTURE HOLD? . . . will climatic change make floods more extreme? or will they get smaller?
Some Important Flood-Generating Tropical Storms Tropical storm Octave Oct 1983 (2) A Change in Frequency or Intensity of Tropical Storms? (1) A Northward Shift in Winter Storm Track? Roosevelt Dam Jan 1993 Winter flooding on Rillito in Tucson (3) A More Intense Summer Monsoon? Sabino Creek July 2006
LOOKING AT FLOODS NATIONALLY & GLOBALLY after Costa (1985)
Extreme Floods of Record evolved from: • uncommon (or unseasonable) locations of typical circulation features (a future manifestation of climate change?) • unusual combinations of atmospheric processes • rare configurations in circulation patterns (e.g. extreme blocking) • exceptional persistence of a specific circulation pattern.
THE GLOBAL PERSPECTIVE! http://floodobservatory.colorado.edu/index.html http://floodobservatory.colorado.edu/Archives/GlobalArchiveMap.swf http://floodobservatory.colorado.edu/archiveatlas/floodrecurrence.htm
Severity > 100 yr # Floods per Year Comparable between 1985-1995 & 1998 - 2003 Flood Causes > 20 yr Causes
Hydroclimatic Regions -- Rivers can be grouped according to how their floods respond to different types of mechanisms and circulation patterns. -- This grouping may change from season to season and might possibly rearrange itself due to climate change and shifting storm tracks.