Download
1 / 5
50 likes | 61 Vues
Nowadays, the automatic specific tests such as Cytogenetics, Immunophenotyping and morphological cell classification can identify the leukemia disease by making experienced operators observing blood or bone marrow microscopic images. The early identification of Acute Lymphoblastic Leukemia ALL symptoms in patients can greatly increase the probability of recovery. When typical symptoms appear in normal blood analysis, those methods are not included into large screening programs and are applied only. The method of blood cell observation using Cytogenetics and Immunophenotyping diagnostic methods are currently preferred for their great accuracy with respect to present undesirable drawbacks slowness and it presents a not standardized accuracy since it depends on the operator's capabilities and tiredness. The detection of leukemia in human blood sample using microscopic images is suitable for low costs and remote diagnosis systems. In this paper presents an implementation of detection and classification of leukemia. The system will use features in microscopic images and examine changes on texture, shape and color analysis. Support Vector Machines SVM is used as a classifier, which classifies into cancerous or not. The detection and classification of ALL is implemented with MATLAB programming language. Ei Ei Chaw | Ohnmar Win "Classification of Leukemia Detection in Human Blood Sample Based on Microscopic Images" Published in International Journal of Trend in Scientific Research and Development (ijtsrd), ISSN: 2456-6470, Volume-3 | Issue-4 , June 2019, URL: https://www.ijtsrd.com/papers/ijtsrd25186.pdf Paper URL: https://www.ijtsrd.com/engineering/electronics-and-communication-engineering/25186/classification-of-leukemia-detection-in-human-blood-sample-based-on-microscopic-images/ei-ei-chaw<br>

E N D
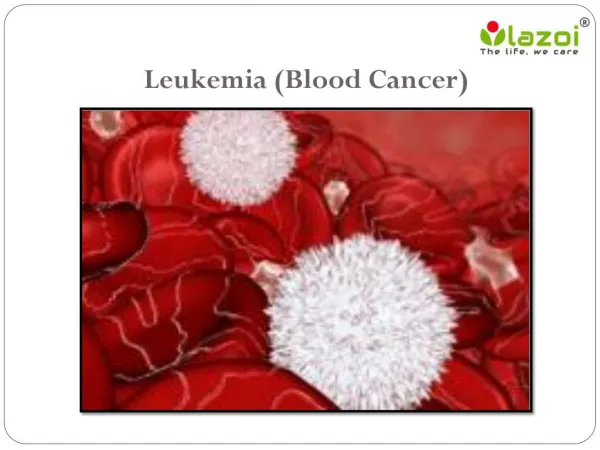
International Journal of Trend in Scientific Research and Development (IJTSRD) Volume: 3 | Issue: 4 | May-Jun 2019 Available Online: www.ijtsrd.com e-ISSN: 2456 - 6470 Classification of Leukemia Detection in Human Blood Sample Based on Microscopic Images Ei Ei Chaw, Ohnmar Win Department of Electronic Engineering, Mandalay Technological University, Mandalay, Myanmar How to cite this paper: Ei Ei Chaw | Ohnmar Win "Classification of Leukemia Detection in Human Blood Sample Based on Microscopic Published in International Journal of Trend in Scientific Research and Development (ijtsrd), ISSN: 2456- 6470, Volume-3 | Issue-4, June 2019, pp.1470-1474, URL: https://www.ijtsrd.c om/papers/ijtsrd25 186.pdf Copyright © 2019 by author(s) and International Journal of Trend in Scientific Research and Development Journal. This is an Open Access article distributed under the terms of the Creative Commons Attribution License (CC BY 4.0) (http://creativecommons.org/licenses/ by/4.0) I. INTRODUCTION Leukemia is a blood cancer which affects the white blood cells (WBCs), it is one of the most dangerous diseases causing fatality among people, particularly in developed countries [1]. Blood is a suspension of millions of cells such as red blood cells, white blood cells and platelets are basically in a clear liquid. They are all made in the factory of blood known as the Bone Marrow and once they are mature, they are released into the blood stream. In the case of leukemia, WBCs become cancerous for reasons that are still not well understood. There are two types of leukemia, namely acute leukemia and chronic leukemia. Acute leukemia is characterized by its rapid and aggressive proliferation of immature cells called the blast cells. On the other hand, chronic leukemia progress slowly over the course of many years. Acute leukemia requires immediately treatment to be given. Acute leukemia is basically classified into acute lymphoblastic leukemia (ALL) and acute myeloid leukemia (AML). The treatment of ALL is different from that of AML. Therefore, it is critically important to determine whether the cell of origin is lymphoid or myeloid as quickly as possible. The microscopic morphological examinations of peripheral blood slides and bone marrow aspiration use in the diagnosis and differentiation of ALL. The PB smear screening is a particular importance because it facilitates a rapid ABSTRACT Nowadays, Immunophenotyping and morphological cell classification can identify the leukemia disease by making experienced operators observing blood or bone marrow microscopic images. The early identification of Acute Lymphoblastic Leukemia (ALL) symptoms in patients can greatly increase the probability of recovery. When typical symptoms appear in normal blood analysis, those methods are not included into large screening programs and are applied only. The method of blood cell observation Immunophenotyping diagnostic methods are currently preferred for their great accuracy with respect to present undesirable drawbacks: slowness and it presents a not standardized accuracy since it depends on the operator’s capabilities and tiredness. The detection of leukemia in human blood sample using microscopic images is suitable for low costs and remote diagnosis systems. In this paper presents an implementation of detection and classification of leukemia. The system will use features in microscopic images and examine changes on texture, shape and color analysis. Support Vector Machines (SVM) is used as a classifier, which classifies into cancerous or not. The detection and classification of ALL is implemented with MATLAB programming language. Keywords: Acute Lymphoblastic Immunophenotyping, Support Vector Machine (SVM). the automatic specific tests such as Cytogenetics, Images" using Cytogenetics and IJTSRD25186 Leukemia (ALL), Cytogenetics, diagnosis and specific treatment [2]. However, it is subject to human error, inter-observer variation and requires highly trained experts. Computer-aided diagnosis system using digital image processing reduces the time as compared to the manual procedure as it allows screening larger number of PB slides [3], it also increase the accuracy of the result by eliminating human error. The computer-aided peripheral blood screening for the purpose of acute leukemia diagnosis and classification consists of image acquisition, blast cell segmentation, feature extraction and classification of blast cell. II. RELATED WORKS In the literature, there are numerous methods are described to detect and classify the presence of leukemia in digital microscopic images. A lot of research has been done on the feature analysis on blood smear images. Ms.Minal, D. Joshi is proposed the blood cell segmentation with histogram equalization, Ostu’s threshold, K-mean clustering etc. and KNN classifier to classify the blast cells [4]. The next paper is proposed by using preprocessing, performed filtering operation to remove noises. Segmentation based mainly on k-mean clustering. The enhancement of image achieved by using mathematical morphology in order to obtain better @ IJTSRD | Unique Paper ID – IJTSRD25186 | Volume – 3 | Issue – 4 | May-Jun 2019 Page: 1470
International Journal of Trend in Scientific Research and Development (IJTSRD) @ www.ijtsrd.com eISSN: 2456-6470 result. The features extracted shape and statistical features and classified SVM classifier [5]. And then, this paper is segmented by watershed segmentation and classified by SVM and KNN classifiers [6]. A major issue in any pattern classification system is the extraction of proper features that effectively differentiate various patterns. Usually in feature extraction, the visual information of an image is analyzed in order to produce features such as shape, texture and color. III. METHODOLOGY The proposed methodology for the classification of leukemia in human blood sample based on microscopic images is shown in Fig. 1. The input for the system has used the image from database which is provided by “ALL-IDB: The Acute Lymphoblastic Leukemia Image Database for Image Processing”, [7]. And then, the input image is pre-processed to upgrade the image quality by using color conversion. The Otsu’s thresholding and morphological operations are used for image segmentation. The segmented image is then given to the feature extraction block, which inheres of region of blast cells analysis for its shape, color and texture features. The extracted features are classified by using the SVM classifier. along the vertical axis, and denotes the color brightness. The advantage of HSV over the RGB is that it appears more intuitive about color in terms of brightness and spectral name rather than the mixture coefficients of R, G, and B. B.Image Segmentation Image segmentation is an essential process for most image analysis subsequent tasks. It makes things easier or change the representation of an image into something that is more meaningful and easier to analyze. And then, it partitions an image into meaningful regions with respect to a practical application. The detection of acute lymphoblastic leukemia cell using microscopic images is segmented by the following steps: 1.Otsu’s Thresholding Thresholding is one of the most powerful tools for image segmentation. The segmented image obtained from thresholding has the advantages of smaller storage space, fast processing speed and ease in manipulation, compared with gray level image which usually contains 256 levels [9]. It is divided into two approaches: global thresholding. When T is constant, this approach is called global thresholding. When T varies for each sub-region, it is called local thresholding. Otsu’s thresholding method is one of the global thresholding. Otsu’s thresholding is a non-linear operation that converts a gray-scale image into a binary image where the two levels are assigned to pixels that are below or above the specified threshold value. where, g(x,y)=output image f (x,y)=input image T = threshold value Otsu’s method is based on threshold selection by statistical criteria. Otsu suggested minimizing the weighted sum of within-class variances of the object and background pixels to establish an optimum threshold. Recall that minimization of within-class variances is equivalent to maximization of between-class variance. Threshold value based on this method will be between 0 and 1. For choosing a thresholding follows this basic procedure: ?Select an initial estimate for T ?Segment the image using T. This will produce two groups of pixels: G1, consisting of all pixels with intensity values ,and G2, consisting of pixels with Figure 1. Overall block diagram of the proposed system A.Image Pre-Processing The blood smear image is given to the computer-aided diagnostic system are usually captured in RGB color space, however, many works in the literature discovered that other color spaces such as HSV, Lab could be more useful than RGB in the extraction of blast cells. The HSV color model represents every color in three components namely Hue (H), Saturation (S), Value (V). It strongly represents colors in a way that is very similar to how the human eye senses color [8]. The HSV is a very popular color space because it separates the pure color aspects from the brightness. Hue band is the angle around the vertical axis corresponding to the spectral frequency and it is arranged on a circle encoded from 0 to 360 degree. Saturation expresses how pure the color is, the more saturated a color and it is represented by the distance from the central axis. While the Value represents the distance values < T. ?Compute the average intensity values and for the pixels in regions G1 and G2. ?Compute a new threshold value: ? (1) ?Repeat steps 2 through 4 until the difference in T in successive iterations is smaller than a predefined parameter . It is based on threshold range by statistical. Otsu suggested minimizing the weighted sum of within-class variances of the object and background pixels to establish an optimum @ IJTSRD | Unique Paper ID – IJTSRD25186 | Volume – 3 | Issue – 4 | May-Jun 2019 Page: 1471
International Journal of Trend in Scientific Research and Development (IJTSRD) @ www.ijtsrd.com eISSN: 2456-6470 threshold. Recall that minimization of within-class variances is equivalent to maximization of between-class variance. Otsu’s thresholding method is based on selecting the lowest point between two classes (peaks). Frequency and Mean value are the following equations to be calculated. , characteristics of the object [11]. Typically, the aim is to process the image in such a way that the image, or properties of it, can be adequately represented and extracted in a compact form amenable to subsequent recognition and classification. 1.Geometric or Shape Features In general, the shape representations can be divided into two categories; boundary-based and region-based. The former uses only the outer boundary of the shape while the letter uses the entire shape region. The most successful representatives for these two categories are Fourier descriptor and moment invariants. The main idea of moment invariants is to use region-based moments which are invariant to transformation, as the shape feature. The following features can be extracted form binary images using the appropriate equations. ?Area – the total number of non-zeros pixels available ?within the image region. ?Circularity – a dimensionless parameter is calculated by area and perimeter. ?Circularity = (4*pi*Area)/Perimeter ?Eccentricity – to measure how much a shape of a nucleus deviates from being circular. ?Eccentricity = 0.5(a–b)/a ?Elongation – abnormal bulging of the nucleus is also a feature which signifies towards leukemia. ?Elongation = Rmax / Rmin ?Rectangularity – the ratio of the ROI’s area to the area of its minimum bounding box. ?Rectangularity =Area/(Major axis*Minor axis) (11) 2.Color Features Color feature is one of the important elements enabling humans to recognize images. Color feature is relatively robust to background complication and independent of image size and orientation. It is considered for extraction from nucleus region of blast cell. Each nucleus image provides the mean color values in color spaces. (2) where, N = total pixel number ni = number of pixels in level I The variation of the mean values for each class from the overall intensity mean of all pixels: Between-classes variance = + Substituting = = ( , , , stands for the frequencies and mean values of two classes, respectively. Derived from this method, threshold value represents between 0 and 1 and the segmented image will be achieved. 2.Morphological Operation Morphological image processing is a collection of non-linear operations related to shape or morphology of features in an image. Morphological operators often take a binary image and a structuring element as input and combine them using a set operator. They process objects in the input image based on characteristics of its shape, which are encoded in the structuring element [10]. Morphology is a technique of image processing based on shapes. A structuring element is a shape mask used in the basic morphological operations. The basic morphological operations are dilation and erosion. Dilation is used to grow or thicken regions in a binary image, while in the gray level image. Dilation is used to brighten small dark areas, and to remove small dark "holes". Dilation on an image by a structure element is denoted and it is represented by the following equation: where, the reflection of B. Erosion is used to reduce objects in the image and known that erosion reduces the peaks and enlarges the widths of minimum regions, so it can remove positive noises but affect negative impulsive noises. The erosion of A by B is also given by the expression: (3) , (4) , (5) (8) (9) (10) (12) 3.Statistical or Texture Features The texture feature provides statistics on the spatial arrangement of intensities in an image; Local Binary Pattern (LPB), and Gray-Level Co-occurrence of Matrix (GLCM). In this system, GLCM is used to measure the texture information of images. The Gray Level Co-occurrence Matrix (GLCM) is based on the extraction of a gray-scale image. The GLCM functions characterize the texture of an image by calculating how often pairs of pixels with specific values and in a specified spatial relationship occur in an image, creating a GLCM, and then extracting statistical measures from this matrix. Statistical parameters calculated from GLCM values are follows: Entropy: The statistical measure of randomness that can be used to characterize the texture of the input image. (6) (7) C.Feature Extraction Feature extraction is one of the most important steps in this system. A feature is a significant piece of information extracted from an image which provides more detailed understanding of the image. The transformation of an image into its set of features is known as feature extraction. A feature is defined as a function of one or more measurements, the values of some quantifiable property of an object, computed so that it quantifies some significant (13) where, p is the number of gray-level co-occurrence matrices in GLCM. Contrast: Measures the local variations in the GLCM. It calculates intensity contrast between a pixel and its neighbor pixel for the whole image. Contrast is 0 for a constant image. @ IJTSRD | Unique Paper ID – IJTSRD25186 | Volume – 3 | Issue – 4 | May-Jun 2019 Page: 1472
International Journal of Trend in Scientific Research and Development (IJTSRD) @ www.ijtsrd.com eISSN: 2456-6470 (14) Correlation: Measures the joint probability occurrence of the specified pixel pairs. (15) Energy: Provides the sum of squared elements in the GLCM. It is also known as uniformity or the angular second moment. Homogeneity: Measures the closeness of the distribution of elements in the GLCM to the GLCM diagonal. Figure3. Load of the blood smear image The first stage of the system is to select the blood smear images from the database by clicking the load image button. And then the required blood smear image is chosen as shown in Fig. 3. In the next step, we need to preprocess images to unify the background of images before converting it to signal. The original colored image is converted to HSV color image as shown in Fig 4. The main reason was that the HSV color space highlights the cell of interest and makes it more prominent than the other components, hence, this makes the localization process more efficient. (16) (17) D. Support Vector Machine (SVM) There are numerous classification methods for automated classification of samples. In this paper it’s decided to work with most popular classification method: Support Vector Machines (SVM). The Support Vector machines were introduced by Vladimir Vapnik and colleagues. Support Vector machines (SVM’s) are a relatively new learning method used for binary classification. The basic idea is to find a hyper plane which separates the D-Dimensional data perfectly into its two classes. However, since example data is often not linearly separable, SVM’s introduce the notion of a kernel induced feature space which casts the data into a higher dimensional space where the data is separable. Namely, the primary goal of SVM classifiers is classification of examples that belong to one of two possible classes. However, SVM classifiers could be extended to be able to solve multiclass problems as well. One of the strategies for adapting binary SVM classifiers for solving multiclass problems is one-against-all (OvA) scheme. It includes decomposition of the M-class problem (M>2) into series of two-class problems. The basic concept is to construct MSVMs where the i-th classifier is trained to separate the class i from all other (M-1) classes. This strategy has a few advantages such as its precision, the possibility for easy implementation and the speed in the training phase and the classification process. That is reason for its wide use. IV. RESULTS AND DISCUSSION Classification for leukemia detection system is proposed in this paper. This work can see implementation main menu of the proposed system as shown in Fig. 2. Figure4. The preprocessing of the input RGB image to HSV color conversion Figure5. The segmented image of the blast cell Segmentation of blast cell is difficult because of the variation of cell shapes, sizes, colors and other various blood cells. After color conversion the input image, it is needed to segment the blast cell by using Out’s Threshold Techniques and morphological operation such as area opening and erosion in order to get the better accuracy of the segmented image as shown in Fig. 5. Figure6. The extracted features and classification results for the cancer image Figure2. The main menu of the proposed system @ IJTSRD | Unique Paper ID – IJTSRD25186 | Volume – 3 | Issue – 4 | May-Jun 2019 Page: 1473
International Journal of Trend in Scientific Research and Development (IJTSRD) @ www.ijtsrd.com eISSN: 2456-6470 In feature extraction the shape, texture and color features are extracted from the segmented image. The extracted features are given as input to the SVM classifier. Once the classifier is trained with the training data set, the test images are given as the input to the SVM classifier. SVM is already trained so that the classifier produces whether the image is cancerous or not. For cancer condition (Cancer), the classifier output is 1, and for normal condition (Healthy) the output is 0. Fig. 6 shows the extracted features and classification results for the cancer image. The extracted features and classification results for the healthy image is shown in Fig. 7. features are classified by the SVM classifier. Using the SVM classifier, leukemia diagnosis system with the accuracy of 86% for cancerous images and the accuracy of 85% for health images is achieved. Acknowledgement First of all, Author would like to thank to her supervisor Professor Dr.Ohnmar Win for her valuable suggestion, and sharing her experience to write this research. And then, the author would like to express special thanks to all the teachers and friends from the of Department of Electronic Engineering, Mandalay Technological University. Also, her appreciation and sincere thanks go to her parents and family for being all the way with her. References [1]Bain, B. J, A beginner’s guide to blood cells: John Wiley & Sons, 2008. [2]Bain, B. J, Diagnosis from the blood smear, New England Journal of Medicine, 2005. [3]Escalante, H. J., Montes-y-Gonzalez, J.A., “Acute leukemia classification by ensemble particle swarm model selection”, 2012. Figure7. The extracted features and classification results for the healthy image [4]Ms. Minal D. Joshi, Prof. Atul H. Karode, Prof. S.R.Suralkar, “White Blood Cells Segmentation and Classification to Detect Acute Leukemia”, Vol 2, Issue 3, May-June 2013. TABLE I ACCURACY OF CLASSIFICATION OF LEUKEMIA DETECTION SYSTEM Images Set Set Cancer Images Health Images To evaluate performance in this system, there are known image from a train data set and an unknown image from a test data set. The system’s accuracy of skin lesion classification is described in Table I. CONCLUSION In this paper, the accurate segmentation of blood sample images is a vital first step for computer aided diagnostic system. Therefore, the input image is converted to RGB color to HSV color in order to get more efficient for the blast cell localization process. And then, segmentation is applied by using Ostu’s threshold techniques and morphological operation to get the better accuracy of segmented blast cell. Features extraction such shape, color and texture features are extracted from the segmented blast cell. The extracted Training Correct Prediction Accuracy Rate [5]Lorenzo Putzu, Giovanni Caocci, Cecilia Ruberto, “Leucocyte Classification for Leukemia Detection using Image Processing Techniques”, Italy, September 2014. 30 26 86% [6]E. A. Mohammed, M. M. A. Mohamed, C. Naugler, B. H. Far, “Chronic lymphocytic leukemia cell segmentation from microscopic blood images using watershed algorithm and optimal thresholding”, IEEE 26th, 2013. 20 17 85% [7]Fabio Scotti, ALL-IDB: “The Acute Lymphoblastic Leukemia Image Database For Image Processing”, 2011, http://homes.di.unimi.it/fscotti/all [8]Smith, A. R., Color gamut transform pairs, USA, August 1978. [9]N.Otsu, “A Thresholding Selection Method from Gray- Level Histograms”, IEEE Transaction on Systems, Man and Cybernetics, Vol.9, NO.1,pp. [10]V. Piuri, F. Scotti, “Morphological Classification of Blood Leucocytes by Microscopic Images”, USA, July 2004. [11]R. C. Gonzalez, R. E. Woods, S.L. Eddins, Digital Image Processing Using MATLAB, USA, 2004. @ IJTSRD | Unique Paper ID – IJTSRD25186 | Volume – 3 | Issue – 4 | May-Jun 2019 Page: 1474