Download
1 / 6
60 likes | 63 Vues
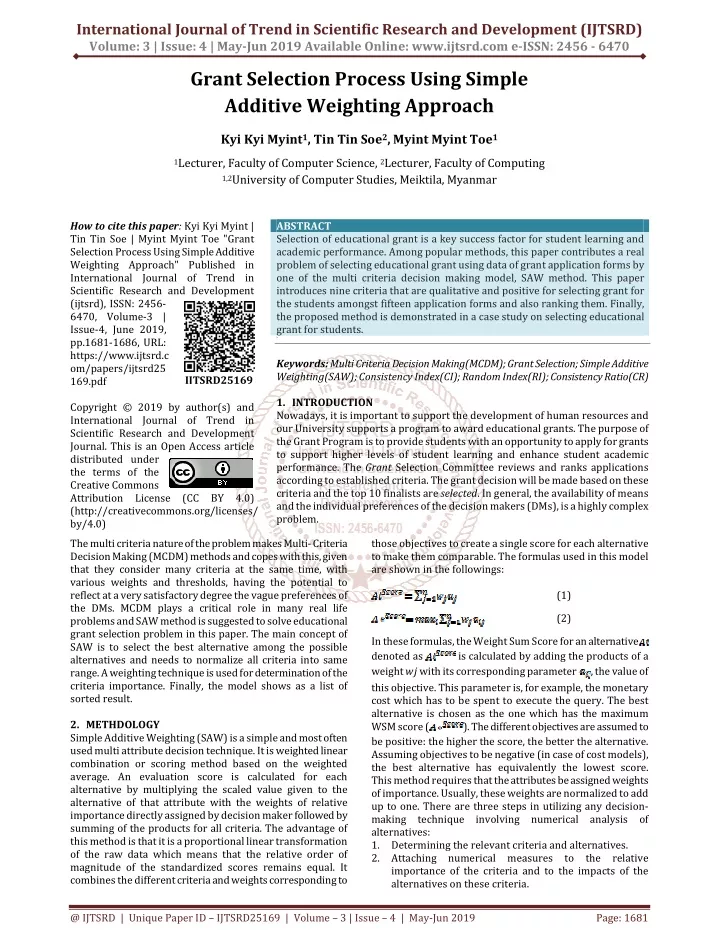
Selection of educational grant is a key success factor for student learning and academic performance. Among popular methods, this paper contributes a real problem of selecting educational grant using data of grant application forms by one of the multi criteria decision making model, SAW method. This paper introduces nine criteria that are qualitative and positive for selecting grant for the students amongst fifteen application forms and also ranking them. Finally, the proposed method is demonstrated in a case study on selecting educational grant for students. Kyi Kyi Myint | Tin Tin Soe | Myint Myint Toe "Grant Selection Process Using Simple Additive Weighting Approach" Published in International Journal of Trend in Scientific Research and Development (ijtsrd), ISSN: 2456-6470, Volume-3 | Issue-4 , June 2019, URL: https://www.ijtsrd.com/papers/ijtsrd25169.pdf Paper URL: https://www.ijtsrd.com/computer-science/simulation/25169/grant-selection-process-using-simple-additive-weighting-approach/kyi-kyi-myint<br>

E N D
International Journal of Trend in Scientific Research and Development (IJTSRD) Volume: 3 | Issue: 4 | May-Jun 2019 Available Online: www.ijtsrd.com e-ISSN: 2456 - 6470 Grant Selection Process Using Simple Additive Weighting Approach Kyi Kyi Myint1, Tin Tin Soe2,Myint Myint Toe1 1Lecturer, Faculty of Computer Science, 2Lecturer, Faculty of Computing 1,2University of Computer Studies, Meiktila, Myanmar How to cite this paper: Kyi Kyi Myint | Tin Tin Soe | Myint Myint Toe "Grant Selection Process Using Simple Additive Weighting Approach" Published in International Journal of Trend in Scientific Research and Development (ijtsrd), ISSN: 2456- 6470, Volume-3 | Issue-4, June 2019, pp.1681-1686, URL: https://www.ijtsrd.c om/papers/ijtsrd25 169.pdf Copyright © 2019 by author(s) and International Journal of Trend in Scientific Research and Development Journal. This is an Open Access article distributed under the terms of the Creative Commons Attribution License (CC BY 4.0) (http://creativecommons.org/licenses/ by/4.0) The multi criteria nature of the problem makes Multi- Criteria Decision Making (MCDM) methods and copes with this, given that they considermany criteria at the same time, with various weights and thresholds, having the potential to reflect at a very satisfactory degree the vague preferences of the DMs. MCDM plays a critical role in many real life problems and SAW method is suggested to solve educational grant selection problem in this paper. The main concept of SAW is to select the best alternative among the possible alternatives and needs to normalize all criteria into same range. A weighting technique is used for determination of the criteria importance. Finally, the model shows as a list of sorted result. 2.METHDOLOGY Simple Additive Weighting (SAW) is a simple and most often used multi attribute decision technique. It is weighted linear combination or scoring method based on the weighted average. An evaluation score is calculated for each alternative by multiplying the scaled value given to the alternative of that attribute with the weights of relative importance directly assigned by decision maker followed by summing of the products for all criteria. The advantage of this method is that it is a proportional linear transformation of the raw data which means that the relative order of magnitude of the standardized scores remains equal. It combines the different criteria and weights corresponding to ABSTRACT Selection of educational grant is a key success factor for student learning and academic performance. Among popular methods, this paper contributes a real problem of selecting educational grant using data of grant application forms by one of the multi criteria decision making model, SAW method. This paper introduces nine criteria that are qualitative and positive for selecting grant for the students amongst fifteen application forms and also ranking them. Finally, the proposed method is demonstrated in a case study on selecting educational grant for students. ` Keywords: Multi Criteria Decision Making(MCDM); Grant Selection; Simple Additive Weighting(SAW); Consistency Index(CI); Random Index(RI); Consistency Ratio(CR) 1.INTRODUCTION Nowadays, it is important to support the development of human resources and our University supports a program to award educational grants. The purpose of the Grant Program is to provide students with an opportunity to apply for grants to support higher levels of student learning and enhance student academic performance. The Grant Selection Committee reviews and ranks applications according to established criteria. The grant decision will be made based on these criteria and the top 10 finalists are selected. In general, the availability of means and the individual preferences of the decision makers (DMs), is a highly complex problem. those objectives to create a single score for each alternative to make them comparable. The formulas used in this model are shown in the followings: IJTSRD25169 (1) (2) In these formulas, the Weight Sum Score for an alternative denoted as is calculated by adding the products of a weight ?? with its corresponding parameter this objective. This parameter is, for example, the monetary cost which has to be spent to execute the query. The best alternative is chosen as the one which has the maximum WSM score ( ). The different objectives are assumed to be positive: the higher the score, the better the alternative. Assuming objectives to be negative (in case of cost models), the best alternative has equivalently the lowest score. This method requires that the attributes be assigned weights of importance. Usually, these weights are normalized to add up to one. There are three steps in utilizing any decision- making technique involving numerical analysis of alternatives: 1.Determining the relevant criteria and alternatives. 2.Attaching numerical measures to the relative importance of the criteria and to the impacts of the alternatives on these criteria. , the value of @ IJTSRD | Unique Paper ID – IJTSRD25169 | Volume – 3 | Issue – 4 | May-Jun 2019 Page: 1681
International Journal of Trend in Scientific Research and Development (IJTSRD) @ www.ijtsrd.com eISSN: 2456-6470 3.Processing the numerical values to determine a ranking of each alternative. The determination of criteria and alternatives are very subjective. Notice that the list of criteria and alternatives are not exhausted list. They neither cover all possible criteria nor all possible alternatives. There is no correct or wrong criterion because it is subjective opinion. Different people may add or subtract those lists. Some factors may be combined together and some criterion may be broken down into more detail criteria. Most of decisions makings are based on individual judgments. A multi-criteria model for ranking m alternatives (A1, A2, …, Am) by n criteria (C1,C2, …., Cn) is presented in Table 1. In this model, the degree in which alternative Ai (i = 1, 2,…, m) satisfies criterion Cj, (j = 1,2,…, n) is denoted by aij. Without loss of generality, we can assume that the criteria are ordered based on importance, from the most important criterion C1 to the least important criterion Cn. For different criteria, the performance values of alternatives can be measured by different units. TABLE I. DECISION MATRIX C1 C2 A1 a11 a12 ….. A2 a21 a22 . . . Am am1 a11 Firstly, the system needs to construct a pair-wise comparison matrix (n × n) for criteria with respect to objective by using Saaty's 1-9 scale of pairwise comparisons shown in TABLE 2. In other words, it is used to compare each criterion with each other criterion, one-by-one. For each comparison, it needs to decide which of the two criteria is most important, and then assign a score to show how much more important it is. Each element of the comparison matrix is computed by its column total and the priority vector is calculated by finding the row averages. Weighted sum matrix is found by multiplying the pairwise comparison matrix and priority vector. Individual elements of the weighted sum matrix have to be divided by their respective priority vector element. The average of this value is computed to obtain . Then, the Consistency Index, , can be found as follows: (3) Where, n is the matrix size. The consistency ratio, CR, is needed to calculate by using the equation (5): (4) ….. Cn a1n a2n . Amn ….. TABLE II SAATY’S 1-9 SCALE of PAIRWISE COMPARISON Intensity of Importance 1 2 3 4 Definition Explanation Equal Importance Weak or Slight Moderate Importance Experience and judgment slightly favor one activity over another Moderate Plus - Experience and judgment strongly favor one activity over another Strong Plus - Very Strong An activity is favored very strongly over another Very, very Strong - The evidence favoring one activity over another is of the highest possible order of affirmation Two activities contribute equally to the objective - 5 Strong Importance 6 7 8 9 Extreme Importance Finally, judgment consistency can be checked by taking the consistency ratio ( is acceptable, if it does not exceed 0.10. If it is more, the judgment matrix is inconsistent. To obtain a consistent matrix, judgments should be reviewed and improved. TABLE III: AVERAGE RANDOM CONSISTENCY (RI) Size of Matrix Random Consistency 1 2 3 4 5 6 7 8 9 10 The system needs to construct a decision matrix (m×n) that includes m alternatives and n criteria. As a final step, each alternative, is evaluated by using Equation (1). This methodology is designed in order to select and consider suitable criteria and education level of seven States in Myanmar. By using Comparison Matrix, the weights of criteria will be ) of with the appropriate value in TABLE III. 0 0 0.58 0.9 1.12 1.24 1.32 1.41 1.45 1.49 @ IJTSRD | Unique Paper ID – IJTSRD25169 | Volume – 3 | Issue – 4 | May-Jun 2019 Page: 1682
International Journal of Trend in Scientific Research and Development (IJTSRD) @ www.ijtsrd.com eISSN: 2456-6470 computed. After computing weights of criteria, specifying of Consistency Rate (CR) will be executed. If Consistency of data is more than 0.1, revision of pairwise comparison must bedone. So we will continue it until consistency Rate reach to less than 0.1. After CR is less than 0.1, it indicates sufficient consistency. In that time, we use WSM method for ranking education level. The procedure of methodology has been shown in Figure 1. Fig. 1: Structure of research work by using MCDM method 3.NUMERICAL STUDY This section presents numerical experiment. Data used in the calculation are collected from grant applications form. By using nine criteria like below, the levels of results are sorted. These criteria have been mentioned in TABLE IV as follow. TABLE IV: NAMES OF CRITERIA Criteria Explanation C1 Parents' Income C2 Number of Siblings C3 Number of Siblings who are attending school C4 Field/Land/Farm or other possessions C5 Can give promise to study hard if he/she get a grant? C6 Having enough financial support for his/her study C7 Parents' health condition C8 Is he/she working currently? C9 Board/Committee recommendation The weights of criteria have been computed by using comparison matrix. Meanwhile, data was gathered by using scale values of 1-5 as shown in TABLE V. TABLE V: DEFINING THE SCALE VALUES OF 1-5 Intensity of important 1 2 3 4 5 Definition Equal importance Moderate importance Strong importance Very strong Extreme importance @ IJTSRD | Unique Paper ID – IJTSRD25169 | Volume – 3 | Issue – 4 | May-Jun 2019 Page: 1683
International Journal of Trend in Scientific Research and Development (IJTSRD) @ www.ijtsrd.com eISSN: 2456-6470 The comparison matrix is shown in TABLE VI, indicating the relative importance of the criterion in the columns compared to the criterion in the rows. The weight of criteria matrix created from comparison matrix is shown in TABLE VII. TABLE VI: DEFINING THE COMPARISON MATRIX CRITERIAC1 C2 C3 C4 C1 1 0.5 0.5 1 C2 2 1 2 0.33 C3 2 0.5 1 2 C4 1 3 0.5 1 C5 3 0.5 1 0.5 C6 1 2 0.5 1 C7 1 2 1 2 C8 2 1 0.5 2 C9 4 2 2 4 TOTAL 17 13 9 13.8 TABLE VII: WEIGHTS OF CRITERIA BY COMPARISON MATRIX W1 0.05464 W2 0.09103 W3 0.10782 W4 0.0819 W5 0.07553 W6 0.07582 W7 0.09815 W8 0.10968 W9 0.20542 The consistency rate was 0.081 that is less than 0.1, indicating sufficient consistency. Calculating the WSM is shown in TABLE VIII. By applying that matrix, we can compute the consistency vector. The result of consistency vector is shown in TABLE IX. TABLE VIII: WEIGHT SUM VACTOR 1.0 0.5 0.5 1.00 0.3 1.0 1.0 0.5 0.25 2.0 1.0 2.0 0.33 2.0 0.5 0.5 1.0 2.0 0.5 1.0 2.00 1.0 2.0 1.0 2.0 1.0 3.0 0.5 1.00 2.0 1.0 0.5 0.5 0.25 3.0 0.5 1.0 0.50 1.0 0.5 1.0 0.5 1.0 2.0 0.5 1.00 2.0 1.0 0.5 0.5 0.33 1.0 2.0 1.0 2.00 1.0 2.0 1.0 0.5 2.0 1.0 0.5 2.00 2.0 2.0 2.0 1.0 0.33 4.0 2.0 2.0 4.00 2.0 3.0 2.0 3.0 TABLE IX: CONSISTINCY VECTOR 0.601176 0.060706 0.992683 0.101146 1.193126 0.119802 0.939665 0.091001 0.808156 0.083922 0.856778 0.084248 1.101336 0.109056 1.216105 0.121868 2.281281 0.22825 The amount of Consistency Index ( ) is calculated using Equation (3), so =0.1232 and the amount of Random Index could be applied by referring Table X, according to the value of n (n is size of matrix). TABLE X: THE AVERAGE STOCHASTIC UNIFORMITY INDEX TARGET VALUE of JUDG MENT MATRIX N 1 2 3 4 5 RI 0 0 0.85 0.9 1.12 1.24 1.32 1.41 1.45 1.51 C5 0.3 2 1 2 1 2 1 2 2 13 C6 1 0.5 2 1 0.5 1 2 2 3 13 C7 1 1 1 1 1 1 1 2 2 10 9.5 4.16 C8 0.5 0.25 1 2 0.5 0.25 0.5 0.5 0.33 0.5 1 3 C9 0.5 0.5 0.5 0.5 0.33 1 0.061 0.101 0.12 0.091 0.084 0.084 0.109 0.122 0.228 0.6 0.99 1.19 0.94 0.81 0.86 1.1 1.22 2.28 0.5 0.5 0.5 = 0.5 1 9.903042 9.814333 9.959146 10.32591 9.629786 10.16966 10.09886 9.978834 9.994658 / = 6 7 8 9 10 @ IJTSRD | Unique Paper ID – IJTSRD25169 | Volume – 3 | Issue – 4 | May-Jun 2019 Page: 1684
International Journal of Trend in Scientific Research and Development (IJTSRD) @ www.ijtsrd.com eISSN: 2456-6470 TABLE XI: SCALING CRITERIA Explanation Parents' Income Number of Siblings Number of Siblings who are attending school Field/Land/Farm or other possessions Can give promise to study hard if he/she get a grant? Having enough financial support for his/her study Parents' health condition Is he/she working currently? Board/Committee recommendation Criteria C1 C2 C3 C4 C5 C6 C7 C8 C9 Scaled values 0-500000 0-6 0-6 0-9 0,1 0-9 0-9 0,1 0-9 To define the decision matrix we need to collect data by using student application forms. Collected data matrix and normalized collected data matrix are shown in TABLE XII and TABLE XIV. In table XIII shows the result of weight criteria by testing of allowable CR. TABLE XII: COLLECTED DATA MATRIX (DECISION MATRIX) Stu. C1 C2C3C4C5C6C7C8C9 S1 100000 3 2 2 S2 200000 2 2 3 S3 120000 4 3 3 S4 150000 1 1 4 S5 300000 2 2 5 S6 400000 4 3 6 S7 200000 2 2 3 S8 450000 5 3 7 S9 260000 2 2 4 S10 180000 1 1 2 S11 220000 4 3 3 S12 320000 2 2 5 S13 450000 3 2 7 S14 500000 3 2 8 S15 240000 2 1 4 TABLE XIII: WEIGHT CRITERIA C1 C2 C3 C4 C5 0.061 0.101 0.120 0.091 0.084 0.084 0.109 0.122 0.228 TABLE XIV: NORMALIZED DECISION MATRIX S1 0.8 0.5 0.3 0.8 1.0 0.6 0.6 1.0 1.0 S2 0.6 0.3 0.3 0.7 0.0 0.3 0.5 1.0 0.7 S3 0.8 0.7 0.5 0.7 1.0 0.6 0.6 1.0 0.9 S4 0.7 0.2 0.2 0.6 1.0 0.6 0.4 1.0 0.8 S5 0.4 0.3 0.3 0.4 1.0 0.2 0.3 0.0 0.7 S6 0.2 0.7 0.5 0.3 0.0 0.0 0.1 0.0 0.2 S7 0.6 0.3 0.3 0.7 1.0 0.4 0.5 1.0 0.9 S8 0.1 0.8 0.5 0.2 1.0 0.0 0.0 0.0 0.3 S9 0.5 0.3 0.3 0.6 0.0 0.4 0.3 1.0 0.6 S10 0.6 0.2 0.2 0.8 1.0 0.3 0.4 1.0 0.8 S11 0.6 0.7 0.5 0.7 1.0 0.3 0.3 1.0 0.5 S12 0.4 0.3 0.3 0.4 1.0 0.2 0.2 0.0 0.6 S13 0.1 0.5 0.3 0.2 0.0 0.0 0.2 0.0 0.3 S14 0.0 0.5 0.3 0.1 0.0 0.0 0.0 0.0 0.3 S15 0.5 0.3 0.2 0.6 1.0 0.1 0.4 1.0 0.7 By applying formula 2 we can compute the score matrix. The simple additive method evaluates each alternative, Ranking resultant score matrix and sorting score matrix are shown in TABLE XV and TABLE XVI. 1 0 1 1 1 0 1 1 0 1 1 1 0 0 1 4 6 4 4 7 9 5 9 5 6 6 8 9 9 8 4 5 4 5 7 8 5 9 6 5 6 7 7 9 6 1 1 1 1 0 0 1 0 1 1 1 0 0 0 1 9 6 8 8 6 2 8 3 5 7 5 5 3 3 7 C6 C7 C8 C9 . @ IJTSRD | Unique Paper ID – IJTSRD25169 | Volume – 3 | Issue – 4 | May-Jun 2019 Page: 1685
International Journal of Trend in Scientific Research and Development (IJTSRD) @ www.ijtsrd.com eISSN: 2456-6470 TABLE XV: RANKING S1 0.751282 S2 0.527386 S 3 0.755262 S4 0.625828 S5 0.423481 S6 0.232646 S7 0.671392 S8 0.330488 S9 0.475814 S10 0.606326 S11 0.606345 S12 0.387376 S13 0.217118 S14 0.176702 S15 0.558215 TABLE XVI: SORTING RANKING RESULTS No. Students Values 1 S3 2 S1 3 S7 4 S4 5 S11 6 S10 7 S15 8 S2 9 S9 10 S5 11 S12 12 S8 13 S6 14 S13 15 S14 alternative and attributes which need normalization decision matrix. SAW ignores the fuzziness of committee’s judgment during the decision-making process. Besides, some criteria could have a qualitative structure or have an uncertain structure which cannot be measured precisely. In such cases, fuzzy numbers can be used to obtain the evaluation matrix and the proposed model can be enlarged by using fuzzy numbers. References [1]Trintaphyllou E, Shu B, Sanchez SN, Ray T, “Multi- criteria decision making: an operations research approach”, In: Webster JG (ed) Encyclopaedia of Electrical and Electronics Engineering, vol 15. Wiley, New York, pp 175–186, 1998. [2]Saaty, T. L. “A Scaling Method for Priorities in Hierarchical Structures”. Journal of Mathematical Psychology, 15: 57-68.12, 1977. I. S. Jacobs and C. P. Bean, “Fine particles, thin films and exchange anisotropy,” in Magnetism, vol. III, G.T. Rado and H. Suhl, Eds. New York: Academic, 1963, pp. 271- 350. 0.755262 0.751282 0.671392 0.625828 0.606345 0.606326 0.558215 0.527386 0.475814 0.423481 0.387376 0.330488 0.232646 0.217118 0.176702 [3]Saaty, T. L,” Fundamentals of Decision Making and Priority Theory with the AHP”, RWS Publications, Pittsburgh, PA, U.S.A, 1994.R. Nicole, “Title of paper with only first word capitalized,” J. Name Stand. Abbrev. , in press. [4]R. Timothy Marler · Jasbir S. Arora, “The weighted sum method for multi-objective optimization: new insights”. Springer-Verlag, 2009. [5]Teknomo, K., “Analytic Hierarchy Process (AHP) Tutorial”, Available http://people.revoledu.com/kardi/tutorial/ahp/ (accessed on 5 February 2013). online: [6]H. Barron, C. P. Schmidt, Sensitivity Analysis of additive multi attributes value models. Operations Research, 46(1), 122-127, 2002. Finally according to the SAW method the best student is S3 and then S1, S7, S4, S11, S10, S15, S2, S9, S5 will be selected for the first 10 students to grant the scholarship. 4.CONCLUSION In this study, we presented one of MCDM methodologies, SAW method for selecting granted students. The method has applied data from grant application forms. MS EXCEL program is used in this work to increase the efficiency and ease- of-use. The application of Simple Additive Weighting (SAW) method in decision making of selecting granted students is done by finding weight sum of criteria for each [7]A. Toloie Eshlaghy et al, Sensitivity analysis for criteria values in decision making matrix of saw method. International Journal of Industrial Mathematics, 1, 69- 75, 2009. [8]Kulik, C., L. Roberson and E. Perry, (2007), The multiple-category problem: category activation and inhibition in the hiring process. Acad. Manage. Rev., Vol. 32 No. 2, pp. 529-48. @ IJTSRD | Unique Paper ID – IJTSRD25169 | Volume – 3 | Issue – 4 | May-Jun 2019 Page: 1686