Download
1 / 29
340 likes | 991 Vues
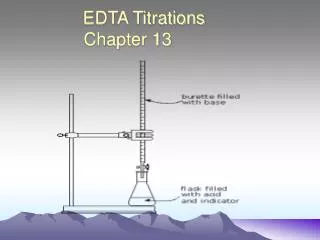
Complexation and EDTA. Chemistry 321, Summer 2014. Complexation allows the titration of metal ions. Chemical analysis scheme:. K f. A ( aq ) + R ( aq ) analyte reagent . AR (s) neutral complex precipitate ( ppt ) .

E N D
Complexation and EDTA Chemistry 321, Summer 2014
Complexation allows the titration of metal ions • Chemical analysis scheme: Kf A (aq) + R (aq) analyte reagent AR (s) neutral complex precipitate (ppt) direct analysis of A; need a relatively clean sample with analyte having inherent properties amenable to quantitative analysis
Complexation allows the titration of metal ions • Chemical analysis scheme: Kf A (aq) + R (aq) analyte reagent AR (s) neutral complex precipitate (ppt) indirect analysis of A Charged complex • should be highly colored to facilitate selective monitoring by absorbance spectrometry Neutral complex • extractable (organic phase) • precipitate (grav. analysis)
Complexation allows the titration of metal ions • Chemical analysis scheme: Kf A (aq) + R (aq) analyte reagent AR (s) neutral complex precipitate (ppt) R often has acid/base properties so you should control the pH !
Complexation allows the titration of metal ions • Chemical analysis scheme: Kf A (aq) + R (aq) analyte reagent AR (s) neutral complex precipitate (ppt) • Filtering to remove particulates from the sample may be required. • If selectivity is not adequate (e.g., a sample with many components), either A or AR species are often analyzed using chromatography.
Complexation allows the titration of metal ions Organics are usually analyzed by extraction from the aqueous phase (covered in latter part of course) Metal ions form polydentate chelates with various organic molecules (called chelating agents). Neutral complex example (bidentateligand) Cu2+ + 2 + 2 H+ 8-hydroxyquinoline (also known as oxine) In this case, the copper ion is part of two 5-membered rings
Charged complex example (tridentate ligand) Again, a 5-membered ring 1,10-phenanthroline Note that the charge on the metal ion does not necessarily need to equal the number of ligands (and note that the complex retains the same charge as the ion).
Notes on complex stability 5- or 6-membered rings are thermodynamically stable Extent of complexation is pH dependent Number of ligands depends on the coordination number of the metal ion For quantitative analysis, as usual, a large Kf is desired Monodentate chelating agents are not used for quantitative analysis (no sharp endpoint)
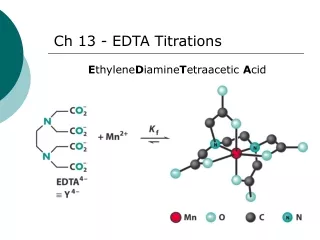
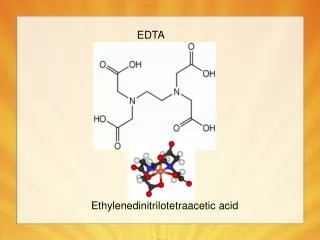
Complexation with EDTA EDTA = ethylene diaminetetra-acetic acid It’s a polyprotic acid, which will be abbreviated “H4Y”. Thus it has five different charge states; only the Y4– state will complex metal cations.
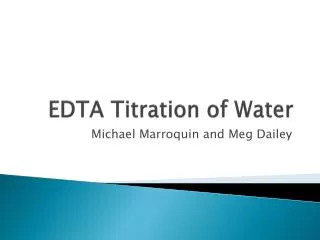
Properties of the metal-EDTA complex The chelation is “claw” type, with all new rings created by the chelation being 5-membered. The coordination of the metal ion itself is octahedral, with four of the ligands O– and the other two to the lone pair on the N.
EDTA complexation equilibrium Kf MY|n–4|– Mn+ + Y4– These Kfs are listed in Table C-4, page 807 One can standardize EDTA concentration using a metal ion with a well-known Kf, then use the standardized concentration to analyze a different metal ion.
A note of caution using EDTA Since the concentration of Y4– is dependent on pH, make sure there is sufficient EDTA in the solution in the first place for the complex to form. For instance, consider the equilibria of the calcium ion Ca2+ with EDTA (there are many typos in the text): Kf H4Y H3Y– H2Y2– HY3– CaY2– Ca2+ + Y4–
A note of caution using EDTA Since the concentration of Y4– is dependent on pH, make sure there is sufficient EDTA in the solution in the first place for the complex to form. For instance, consider the equilibria of the calcium ion Ca2+ with EDTA (there are many typos in the text): Kf H4Y H3Y– H2Y2– HY3– CaY2– Ca2+ + Y4–
A note of caution using EDTA Since the concentration of Y4– is dependent on pH, make sure there is sufficient EDTA in the solution in the first place for the complex to form. For instance, consider the equilibria of the calcium ion Ca2+ with EDTA (there are many typos in the text): Kf H4Y H3Y– H2Y2– HY3– CaY2– Ca2+ + Y4– Another way to express the equilibrium is: Ca2+ + H4Y CaY2– + 4 H+
A note of caution using EDTA Since the concentration of Y4– is dependent on pH, make sure there is sufficient EDTA in the solution in the first place for the complex to form. For instance, consider the equilibria of the calcium ion Ca2+ with EDTA (there are many typos in the text): Kf H4Y H3Y– H2Y2– HY3– CaY2– Ca2+ + Y4– Another way to express the equilibrium is: Ca2+ + H4Y CaY2– + 4 H+ At increasing acidity (lower pH), H4Y will be favored
The alpha plot for EDTA complexation The formal concentration of EDTA = CH4Y = [Y4–] + [HY3–] + [H2Y2–] + [H3Y–] + [H4Y] Note that complexed Y (e.g., CaY2–) does not count toward CH4Y
For complexation with EDTA, only the fraction that is Y4– matters Since complex formation occurs only with Y4–, the pH of the solution needs to be quite alkaline. Plotted in red in the alpha plot (see eq. 9-12 and fig. 9-1) – seems αY4– = 0 at or below pH 8.
Ca2+ αY4– = 1.0 up here log αY4– A log alpha plot 4 6 8 10 12 14 pH
Ca2+ αY4– = 1.0 up here log αY4– At pH 8, αY4– = 0.0056 (not 0) A log alpha plot 4 6 8 10 12 14 pH
Ca2+ αY4– = 1.0 up here log αY4– At pH 8, αY4– = 0.0056 (not 0) Even minute amounts of Y4– can produce complexation 4 6 8 10 12 14 pH
Solving for αY4– To determine the mole fraction of Y4– (the complexing form) in a solution, you can expand the fraction [Y4–]/CH4Y, as done for other polyprotic acids previously. You end up with an expression given in equation 9.12 (page 300) in the text: Where Ka1, Ka2, Ka3,and Ka4 are the stepwise acid dissociation equilibrium constants. Note that the right side of the expression only depends on hydrogen ion concentration (which is pH). The limiting behavior of this equation conforms to the shape of the curve given on the previous slide.
To determine the concentration of Ca2+ from titration with standardized EDTA Replacing [Y4–] in the Kfexpression: Strategy: • Look up Kf for Ca2+/EDTA in Table C.4 ( = 5.01 × 10¹⁰) • Calculate αY4– using equation 9.12 • Calculate [CaY2–] and CH4Y using ICE table • Solve for [Ca2+]
Alternatively, the conditional formation constant Kf’ may be used You can re-express the formation constant equilibrium expression in such a way as to keep all the pH dependence out of the right-hand side of the equation: Define Kf’as the conditional formation constant = Kf αY4– Taking the logarithm of both sides: log Kf’ = log Kf + log αY4–
Alternatively, the conditional formation constant Kf’ may be used You can re-express the formation constant equilibrium expression in such a way as to keep all the pH dependence out of the right-hand side of the equation: Define Kf’as the conditional formation constant = Kf αY4– Taking the logarithm of both sides: log Kf’ = log Kf + log αY4– pH dependent constant for a given metal
Using the conditional formation constant The goal is to quantitatively titrate 99.9% of a metal ion in a solution using EDTA. To do this successively, you must predict and control (using pH) the percent complexation. Kf’ MY|n–4|– Mn+ + Y4– Initial 0 0 [MY]0 Change +x +x –x Equilibrium x x [MY]0 –x
Using the conditional formation constant In a quantitative titration, at the equivalence point, you can treat the solution as if it were made from dissolving MY|n–4|– and then letting that equilibrate into small amounts of Mn+ and various forms of EDTA. In other words, [Mn+] = CH4Y = x (from ICE table) (if x << [MY]0)
Using the conditional formation constant In a quantitative titration, at the equivalence point, you can treat the solution as if it were made from dissolving MY|n–4|– and then letting that equilibrate into small amounts of Mn+ and various forms of EDTA. In other words, [Mn+] = CH4Y = x (from ICE table) (if x << [MY]0) The quantitative goal of 99.9% of Mn+ titrated can be expressed: 0.1%
Estimating the minimum amount of metal ion that can be titrated using EDTA Rearranging the previous inequality: Substituting into the Kf’ expression: Simplifying: Which, prior to titration is equal to:
Challenge problem Consider a magnesium ion titration with EDTA. The initial con-centration of the sample to be titrated [Mg2+] = 1.0 × 10⁻² M. If Kf for magnesium ion with EDTA is 6.2 × 10⁸, • can the magnesium ion be quantitatively (99.9%) titrated at pH 10.00? • can the magnesium ion be quantitatively (99.9%) titrated at pH 8.00? Show the calculation to support your answers.


![Structure of [ Co(EDTA) ] -](https://cdn3.slideserve.com/7013174/slide1-dt.jpg)