Download
1 / 49
490 likes | 671 Vues
Quantitation strategies. Jonathan Trinidad Department of Pharmaceutical Chemistry. Typical Sample Permutations. Gene knockdowns or over expression Inhibitors: eg antibodies or siRNA Growth factors/hormones Cell-cell interactions Drug treatment. Methodology. 2D gel electrophoresis

E N D
Quantitation strategies Jonathan Trinidad Department of Pharmaceutical Chemistry
Typical Sample Permutations Gene knockdowns or over expression Inhibitors: eg antibodies or siRNA Growth factors/hormones Cell-cell interactions Drug treatment
Methodology 2D gel electrophoresis silver stain Fluorescence Difference Gel Electrophoresis Pro-Q Diamond 2,4-dinitrophenylhydrazine MS-based quantification methods “label-free” stable isotope incorporation Protein expression array analysis
Quantification using mass spectrometry Non-isotope methods Stable isotope methods (MS and MS/MS) metabolic enzymatic chemical Relative versus absolute quantification Unstable isotope methods
Factors affecting the accuracy of MS-based quantification Efficiency/uniformity of labeling Sample handling variability prior to analysis or sample combination Resolution in the MS, of the peaks used for quantification Specificity of given peptides
Label-free estimates of absolute abundance Many factors influence the detectability of peptides during an LC-MS/MS experiment. In general, during analysis of complex mixtures, the higher the relative concentration of a given protein, the greater the number of peptides that will be identified from it (and the more intense each of those peptides’ MS intensities). A number of attempts have been made to roughly estimate a protein’s abundance based upon these parameters. Rappsilber et al. Genome Res. 2002 Sanders et al. Mol. Cell. Biol. 2002 Ishihama et al. MCP 2005 Silva et al. MCP 2006
How to calculate spectral count? • Spectral counting: • Spectral abundance factor • = (SpC)k/i=1 (SpC)i N 2. Normalized spectral abundance factor Old WM, et al Mol Cell Proteomics. 2005 Oct;4(10):1487-502. Paoletti AC, et al.Proc Natl Acad Sci U S A. 2006 Dec 12;103(50):18928-33.
Label-free relative quantification Extracted ion chromatography (XIC)-based quantification For each peptide, sum the total signal observed during its elution. Similar to the Beer-Lambert law with 10 caveats. At the protein level, you can add all peptides, or the top three peptides. Spectra counting Straightforward in its application. Count each instance of MS/MS acquisition for all the peptides associated with a given protein. Spectra count is “roughly” proportional to relative abundance. Dependent upon IDA-type experiments.
Label-free relative quantification The accuracy of these approaches is dependent upon several factors: High mass accuracy is critical for knowing the identify of peptides across runs when MS/MS may not have always been obtained. The reproducibility of chromatographic analysis is a key parameter. Chromatographic variations can be addressed after the fact, but XIC quantification is not generally applicable to multi-dimensional analysis.
Peaks in replicate LC-MS runs can be aligned using software algorithms Prakash et al. MCP 2006
Peaks in replicate LC-MS runs can be aligned using software algorithms Prakash et al. MCP 2006
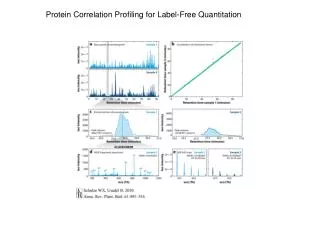
Proteomic Characterization of the Human Centrosome by Protein Correlation Profiling • Discovered several new centrosomal components that may be linked to human disease. • Developed a strategy, PCP (protein correlation profiling), that can be used to study other multiprotein complexes. • Especially useful for proteins that can’t be purified to homogeneity. Andersen JS, et al Nature. 2003;426(6966).
Purification and MS Analysis Procedures Culture human KE37 cells to exponential growth Isolated centrosomes dissolved in 8M urea buffer Reduction/Alkylation Treat with nocodazole and cytochalasin D (arrest in G2/M) Lys-C/Trypsin Digestion Hypotonic lysis Desalted/Concentrated Sucrose gradient purification and fractionation Reverse Phase Separation coupled to LC MS/MS In solution digestion of proteins or 1D SDS-PAGE followed by digestion Data Analysis using Mascot program (IPI database) NanoLC MS/MS
500 proteins identified in peak centrosome fraction (7). • 47 out of 60 known centrosomal proteins identified • 90 uncharacterized proteins identified 1st Validation Method: Immunolocalization 32 of 90 previously uncharacterized proteins identified by MS were tagged with GFP and expressed in U2OS cells. 19 of 32 proteins tested localized to the centrosome
Different experimental designs lead to combination of samples at different points in the analysis
1H versus 2H 12C versus 13C 14N versus 15N 16O versus 18O
Metabolic labeling Stable Isotope Labeling in Cell Culture (SILAC)
Metabolic labeling 15N labeling can be used, or alternatively specific amino acids (generally arginine or lysine) Ideally, the cells will be grown for a number of generations to insure complete incorporation of the isotopic amino acid(s). yeast, e. coli; mammalian cell lines; C. elegans; D. melanogaster; rattus rattus (Krijgsveld 2003, Wu et al. 2004)
Preparation For SILAC Experiments Ong SE, Mann M. Nat Protoc. 2006;1(6):2650-60.
Quantitation of Protein Ratios from Peptide Doublets Blagoev B et al. Nat Biotechnol.
Strategy to Study Activated EGFR Complex Using SILAC Blagoev B et al. Nat Biotechnol.
Multiple SILAC experiments can be combined to create timecourses Blagov et al. Nat Bio 2004
Temporal Changes in the Nucleolar Proteome Upon Transcriptional Inhibition Andersen JS, et al, Nature. 2005
Quantification of the synaptosomal proteome of the rat cerebellum during post-natal development Feed mice a diet consisting entirely of 15N as the only nitrogen source McClatchy et al Genome Research 2007
SILAC Mouse for Quantitative Proteomics Uncovers Kindlin-3 as an Essential Factor for Red Blood Cell Function Kruger et al Cell 2008
Top-Down Quantitation and Characterization of SILAC-Labeled Proteins 13C615N4-Arg 13C614N2-Lys Waanders, L.F. et al. J Am Soc Mass Spectrom. 2007
Enzymatic labeling Carboxypeptidases (e.g. trypsin) can incorporate two oxygen molecules Aminopeptidases (e.g. Lys-N) can incorporate one oxygen molecule Enzymatic digests are self limiting
Enzymatic labeling The carbonyl oxygen exchange reaction has proven difficult to optimize, resulting in peptides with variable levels of incorporation. This complicates quantitation.
ICAT Isotope coded affinity tag Gygi et al 1999
Cleavable ICAT Acid cleavable linker facilitates release Heavy and light carbon allows for co-eluting peptides So user-friendly, knowledge of the structure is not required
iTRAQ Isobaric Tags for Relative and Absolute Quantitation Ross et al MCP 2004
iTRAQ quantification information is contained in the MS/MS spectra
Zoom in view of the iTRAQ ion region showing approximately 6-fold more signal in the peptide from m/z 117 versus m/z 116
iTRAQ can be used to construct four datapoint timecourses Zhang et al. MCP 2005
A schematic of the new 8-channel (8-plex) iTRAQ reagent Pierce A, et al. Mol Cell Proteomics. 2008
An example of Protein Quantitation Using 8-plex iTRAQ Reagents
Tandem mass tags present an alternative multiplexing approach Thermo
Absolute quantification Absolute quantification is relative quantification using synthetic isotopes of known concentration. These can be synthesized in a traditional fashion (AQUA). Purification and quantification of the standards is often cost prohibitive. Recently, quantified microsynthesized isotopic standards have become commercially available. For unmodified peptides, QconCAT can be used to synthesize large numbers of isotopic peptides.
Absolute Quantitation Using Synthetic Proteins - QconCAT or Peptide-concatenated standard (PCS) Pratt JM, et al. Nat Protoc. 2006;1(2):1029-43. ; Kito K, et al. J Proteome Res. 2007 Feb;6(2):792-800 Kito K, et al. J Proteome Res. 2007 Feb;6(2):792-800
Differential enrichment using an array of drug-coated beads can be used to identify target protein complexes. Oda et al. Anal. Chem. 2003
Changes in the composition of macromolecular complexes can be examined as a function of molecular state Ranish et al. Nat Gen 2003
Turnover rates for individual proteins can be determined using isotopic labeling Pratt et al. MCP 2002
Retrospective Birth Dating of Cells in Humans Using bomb pulse 14C levels and accelerator mass spectrometry to calculate the age of cells in the body Spalding et al Cell 2005
Selective reaction monitoring Selective reaction monitoring is conducted on a triple-quadrupole mass spectrometer. It requires a list of known targets, the m/z values of the precursor mass and the m/z of prominent fragment ions. These can be empirically determined or theoretically generated using algorithms. Q1 is set to selectively pass a specific precursor m/z. Q2 is set as the collision cell. Q3 is set to selectively pass a specific fragment ion. The scans can be quick, on the order of 5 msec. 400 different SRMs can therefore be analyzed every 2 seconds. If the LC retention time is know, these could be scheduled to allow for the acquisition of several thousand SRMs in a single run. This technique can be used in a label-free fashion, used with SILAC or isotopic standards.
Extracting biological insight from quantitative protein lists is the difficult part. A number of approaches have been developed, and have initially been applied to microarray data.