Download
1 / 26
260 likes | 351 Vues
Redesigning CBP indicator structure and communication strategy. Indicator Redesign Taskforce. The Indicators Redesign Taskforce. A temporary group formed to recommend solutions for the current deficiencies in the CBP indicators and the way they are communicated.

E N D
Redesigning CBP indicator structure and communication strategy Indicator Redesign Taskforce
The Indicators Redesign Taskforce • A temporary group formed to recommend solutions for the current deficiencies in the CBP indicators and the way they are communicated. • Group is compromise between efficiency (small size) and links to every interest group (large size). • Members: • Carlton Haywood (Chair), ICPRB Rich Batiuk, EPA/CBPO • Mike Burke, EPA/CBPO Bob Campbell, NPS/CBPO • Peter Claggett, USGS/CBPO Chris Conner, ACB/CBPO • Bill Dennison, UMCES Rick Hoffman, VA DEQ • Mike Land, NPS/CBPO Ben Longstaff, NOAA / UMCES • Bruce Michael, MD DNR Steve Preston, USGS/CBPO • Nita Sylvester, EPA/CBPO Ken Moore, VIMS • Gary Shenk, EPA/CBPO
What are the current deficiencies… Current communication has led to: • Sometimes incorrect / confusing messages being received • Chesapeake Bay Program may not be the primary source of information • Information generally relates to the ‘whole bay’. Not enough information about local waterways • Information not always presented in a timely fashion … “being Posted” … reporting based primarily on qualitative information …… “being scooped”
What are the current deficiencies… Current Indicators: • There are many indicators (100+) • Mix ‘state of the Bay’ and ‘state of the Bay restoration’ messages • No hierarchy of importance • Few overarching indices • Presented stand alone style - don’t tell a complete story • Long lag time between monitoring and indicator availability • Often have poor spatial representation Current list of Chesapeake Bay Program indicators as they appear on the website
What we need… An indicator framework that: • Provides a hierarchy based on the level of detail required, from broad overall levels/conditions to geographically specific details; • Minimizes potential for confusing indicator function. That is, whether they relate to State of the Bay, the State of the Bay restoration and those factors that affect Bay health (stressors); • Facilitates the interpretation and communication of indicator interconnectivity through the development and presentation of storylines; • Is closely aligning with the Bay Program’s overall communication strategy; and • Is relatively simple, avoiding numerous categories or complex relationships.
e.g. Riparian buffer restoration (miles restored) e.g. Nontidal sediment loads and river flow (m lbs/year) Indicator Framework:Three functional groups e.g. State of submerged aquatic vegetation (distribution - ha)
Indicator Hierarchy Functional group Role
Proposed reporting indicators • Approximately 35 reporting indicators • 3 to 6 indicators / category • The indicator measure/metric still has to be determined by the appropriate Subcommittee, workgroup and/or team of experts
Indices • Top level index values should be based on attainment/non-attainment of established criteria/goals. • Incorporate factors such as the: • volume or surface area of the waterway in attainment; • frequency that attainment is reached; and • degree or amplitude of attainment/non-attainment
Diagnostic Indicators • Facilitate interpretation of the reporting indicators; and/or • Address topics of special interest • Not used in the generation of top level or overarching indices
Communication Strategy • Target Audience • Interested public, agency managers, policy decision makers • Website is the primary communication tool • Redesign website to reflect indicator structure • Separate indicators into functional groups • Place reporting indices, top level and overarching indices most upfront/accessible • Develop/improve website products • Improve indicators: Spatial detail, presentation and timeliness of reporting indicators • FAQs / Storylines: Provide answers to target audience questions • Annualcommunication cycle: Restoration effort, Bay stressor and Bay ecosystem health • Use e-newsletter to drive audience to website & engage a larger audience
E-Newsletter • A proactive way to disseminate our information and drive users to the site for additional information. • Monthly, starting in May 2005 • Each issue will contain: • Bay Health, Bay Restoration, Bay Stressor articles (detailed spreadsheet available). • Need to be related/linked - provide cohesive overall story • Need to target the questions most frequently asked by the target audience • Reliant upon timely, well synthesized and presented content • Other content: Critter of the month, Bay Journal Tease, Gateway site, What you can do
Summer Forecast Goals • Forecast summer conditions for a variety of key indicators using: • Established relationships with Bay stressors (e.g. flow/weather) • Prior year’s living resource population and distribution • Improve forecast capacity: • Incrementally adding predictions of different indicators • Reducing uncertainties of current indicators • Effectively communicate the predictions and associated uncertainties to the Chesapeake Bay community.
Annual Summer Highlights Goals • Review the previous summer environmental conditions and highlight the most significant developments • Include meteorological and unusual biotic events. • Provide a short explanation for the events highlighted • Compare the summer predictions with the actual conditions obtained, providing explanations for discrepancies. • Effectively communicate summer highlights in a timely manner to the Chesapeake Bay community. 2004 Summer highlights newsletter
Annual Integrated Assessment Goals • Conduct an annual assessment of key indicators. • Develop an integrated ecosystem health assessment for the bay and its tributaries using the various key parameters. • Create a ranking valuation scheme to compare assessments both geographically and over time (annual assessments). • Develop an improved assessment capacity: • improving the timeliness of various data processing steps • developing additional key indicators. • Effectively communicate the integrated assessments with spatially explicit maps and rigorous scientific assessments to the Chesapeake Bay community.
How will this happen?Only with the commitment of the CBP community - committees/workgroups/individuals
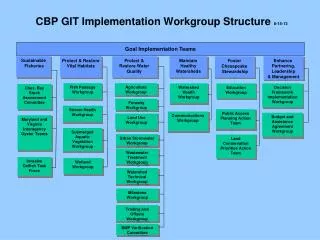
1. Tidal Monitoring and Analysis Workgroup Indicator Topics Indentified for Fast Track Revision • Dissolved Oxygen • Nutrient Status and Trends • Chlorophyll • Clarity 2. Nontidal Water-Quality Workgroup • Flow • Loads • Flow-Adjusted Concentration Trends 3. Living Resources Subcommittee • SAV • Oysters 4. Nutrient Subcommittee • BMP Implementation
Nontidal Workgroup Indicators