Download
1 / 15
150 likes | 260 Vues
America’s Homeless II Populations and Services. February 1, 2000. URBAN INSTITUTE 2100 M Street NW Washington DC 20037 paffairs@ui.urban.org www.urban.org. America’s Homeless II Populations and Services.

E N D
America’s Homeless IIPopulations and Services February 1, 2000 URBAN INSTITUTE 2100 M Street NW Washington DC 20037 paffairs@ui.urban.org www.urban.org
America’s Homeless IIPopulations and Services Even in a booming economy, at least 2.3 million adults and children, or nearly 1 percent of the U.S. population, are likely to experience a spell of homelessness at least once during a year. This likelihood grows to 6.3 percent if one considers only people living in poverty, according to the newest national analysis of homelessness by Urban Institute researchers Martha Burt and Laudan Aron. At the same time, there is a bigger and more diverse network of homeless services than in 1987, when the Urban Institute released earlier national estimates of the homeless population. Burt and Aron developed the new estimates from the 1996 National Survey of Homeless Assistance Providers and Clients (NSHAPC). The NSHAPC covers suburban, rural, and urban areas, and was conducted in 1996 by the U.S. Census Bureau. In December 1999, the Federal Interagency Council on the Homeless released descriptive data from the survey, but did not include population estimates. The new independent analysis by Burt and Aron provides estimates of the size of the nation’s homeless population in 1996 and enables a comparison with 1987 estimates of homelessness. No local population estimates are available. URBAN INSTITUTE 2
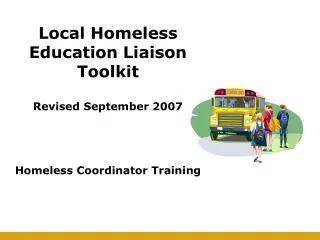
America’s Homeless II — Populations and Services Data Sources The homeless population may be underestimated in rural areas and other locations where there are no or few homeless services. After accounting for these challenges Burt and Aron characterize their results as lower-bound estimates. • Survey of 6,300 program representatives, collected from programs in February 1996 • Survey of 4,200 program users/clients, collected from programs in October 1996 URBAN INSTITUTE 3
America’s Homeless II — Populations and Services Programs Surveyed for Client Datain October 1996 Client data were collected in October, while program data were collected in February. Client data were collected only from programs open in both February and October. Emergency shelters open in October Transitional housing Permanent housing Voucher distribution Rural food pantries Soup kitchens open in October Mobile food programs open in October Targeted outreach programs open in October Drop-in centers open in October Other targeted programs open in October URBAN INSTITUTE 4
America’s Homeless II — Populations and Services Underlying Challenges The estimates take into account the amount of turnover within the homeless population, variation in the length of homeless spells, multiple contacts with homeless services by a single client, and seasonal variations in homelessness. • Data source: NSHAPC only includes service users • Double-counting: people may use more than one service • Accuracy: providers usually overestimate size of population served • Seasonal variation: fewer programs open in October than February • Client diversity: programs used by homeless AND non-homeless people • Turnover: clients vary in length of homeless spells. URBAN INSTITUTE 5
America’s Homeless II — Populations and Services Types of Estimates Taken together, the estimates bring the nation as close as possible to a full representation of homeless adults and children. The estimates yield a margin of error of plus or minus 6 percent. The estimates refer to the number of homeless (households or people) who used homeless assistance programs in an average point in time (day or week) during a month (October or February) in 1996. • Homeless Clients (households)* • Homeless People (adults and children) Population Time Period • 7-day Estimates • 1-day Estimates • Annual Projections * at least one adult URBAN INSTITUTE 6
America’s Homeless II — Populations and Services Number of Homeless Who Used Homeless Assistance Programs The researchers suggest that estimates of how many homeless people used homeless programs in an average week are more meaningful as an indicator of the number of homeless people than are estimates for an average day. THOUSANDS Average Week Average Day URBAN INSTITUTE, 2000 URBAN INSTITUTE 7
America’s Homeless II — Populations and Services Number of Homeless Children Who Used Homeless Assistance Programs in An Average Week Children represent a significant share of homeless people who used homeless services. THOUSANDS 24% of homeless people 22% of homeless people URBAN INSTITUTE, 2000 URBAN INSTITUTE 8
America’s Homeless II — Populations and Services Range of Weekly Estimates of Homeless People Who Used Services The Urban Institute’s two 1996 estimates fall on either side of the 1987 estimates. After taking all assumptions into consideration, the researchers conclude that the higher 1996 estimate is more representative of the full homeless population, and that the size of the homeless population since 1987 has increased. Winter 1996 Estimate842,000 High March 1987 Estimate600,000 Low March 1987 Estimate500,000 Fall1996 Estimate444,000 400,000 850,000 URBAN INSTITUTE, 2000 URBAN INSTITUTE 9
America’s Homeless II — Populations and Services Number Likely to Be Homeless at Least Once in a Given Year Client data on first-time spells of homelessness begun in the past week were used to develop annual projections. The number of such spells was multiplied by 51 (the remaining weeks in a given year) and was then added to the average week estimate. The calculation assumes that turnover is constant. URBAN INSTITUTE, 2000 URBAN INSTITUTE 10
America’s Homeless II — Populations and Services Percentage of Annual Projections Likely to Be Children in a Given Year Many children are likely to experience a period of homelessness at least once during a year. Childhood homelessness is a strong risk factor for adult homelessness. Children Adults MILLIONS 3.5 million people 3.5 61% 2.3 million people 76% 1.8 39% 24% 0 from October 1996 weekly estimate from February 1996 weekly estimate URBAN INSTITUTE, 2000 URBAN INSTITUTE 11
Annual Projections from October 1996 Average Week Estimates .9 percent 6.3 percent 6.2 percent America’s Homeless II — Populations and Services National Context of Annual Projections Homelessness is a reality for a large segment of the overall population, in spite of a booming economy, or perhaps because of it. The percentage of poor people likely to be homeless in a year is especially high in part because of the persistence of poverty and the rising costs of housing. Annual Projections from February 1996 Average Week Estimates 1.3 percent 9.6 percent 9.3 percent U.S. population U.S. population in poverty U.S. children in poverty URBAN INSTITUTE, 2000 URBAN INSTITUTE 12
America’s Homeless II — Populations and Services Changes in Expected Use of Homeless Services on an Average Day (provider estimates) Homeless services increased after passage of the 1987 McKinney Act, which funded many types of homeless assistance programs. The capacity of transitional and permanent housing programs in 1996 was equal to the capacity of emergency shelters in 1988. Shelter/Housing Beds Winter 1988 February 1996 National Total 275,000* 607,000 Emergency Shelters 239,600 Transitional Housing 160,200 Permanent Housing 114,000 Voucher Distribution 67,000 Voucher Acceptance 26,900 Meals National Total 569,100 Soup Kitchens 522,300 Mobile Food Programs 46,800 March 1987 Big/Central Cities Total 97,000 382,100 Soup Kitchens 352,600 Mobile Food Programs 29,500 *U.S. HUD 1988 data on capacity URBAN INSTITUTE, 2000 URBAN INSTITUTE 13
America’s Homeless II — Populations and Services Expected Use of Other Homeless Services on an Average Day in February 1996 (provider estimates*) The homeless service network now offers more than housing and meal services, and serves other people in addition to the homeless, such as the formerly homeless or those who have never been homeless. *Data available only in 1996 URBAN INSTITUTE, 2000 URBAN INSTITUTE 14
America’s Homeless II — Populations and Services The analysis was made possible with support from the Melville Charitable Trust and the Fannie Mae Foundation. This publication and a related press release is available on the Urban Institute’s Web site at www.urban.org, or by calling the Urban Institute’s Office of Public Affairs at (202) 261-5709. “The growth of the homeless assistance network can be considered a success story from the point of view of the homeless people who are now receiving services. But housing costs are on the rise in metropolitan areas, while extreme poverty and other vulnerabilities are facts of life for millions of people, homeless and otherwise. Preventing homelessness in a booming economy is an ongoing challenge.” — Martha R. Burt URBAN INSTITUTE 15