Download
1 / 59
590 likes | 678 Vues
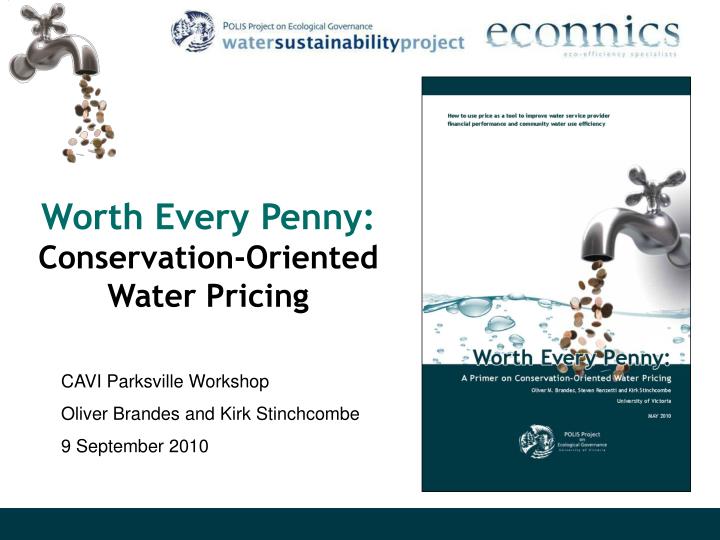
Worth Every Penny: Conservation-Oriented Water Pricing. CAVI Parksville Workshop Oliver Brandes and Kirk Stinchcombe 9 September 2010. Project Mission

E N D
Worth Every Penny:Conservation-Oriented Water Pricing CAVI Parksville Workshop Oliver Brandes and Kirk Stinchcombe 9 September 2010
Project Mission To raise awareness among water utility practitioners and government decisions makers about the effect that pricing can have on water demand and financial viability -- To catalyze a national dialogue --
Presentation Overview What is Conservation-Oriented Water Pricing? Canada’s Current Situation Setting Up a Conservation-Oriented Pricing System Mitigating Potential Downsides How to Get There From Here
What is Conservation-Oriented Water Pricing? A rate structure adopted by a water service provider where: The costs of providing the services are recovered Individual customers are metered and pay for the volume of water they use The price signal is sufficient to affect individual decisions and encourage conservation and efficiency
What the Price of Water Does: • provides enough revenue to at least cover the full costs of providing the service; financial stability; • provides a financial incentive for customers to use water efficiently; • provides information about how much water consumers demand; and, • promotes innovation.
Source: Council of Canadian Academies (2009). The Sustainable Management of Groundwater in Canada, Ottawa, p. 115.
Conservation-Oriented Pricing: Three Prerequisites • Metered water use • Volume based charging • A rate sufficiently high to affect decision making
How Canada Fares: Metering As of 2006, 63.1% of residential customers were metered…
Percent of Canadian Single Family Dwellings That Are Metered (2006) Responding Population = 27 927 531 Source: based on data from Environment Canada (2009). Municipal Water and Wastewater Survey: Municipal Water Use 2006 Summary Tables, Ottawa.
How Canada Fares: Volume Based Charging As of 2004, 29.9% of Canadian residents are still billed on a flat rate or tax assessment basis. And, again, there is considerable province-to-province variability.
How Canada Fares: Volume Based Charging But… we are improving over time… Source: Environment Canada (2008). Municipal Water Pricing Report (2004 Statistics), available at www.ec.gc.ca/Water/en/manage/data/e_MUP2008.pdf.
How Canada Fares: Meaningful Prices Source: based on OECD (2010). Pricing Water Resources And Water And Sanitation Services, ENV/EPOC/GSP(2009)17/FINAL, Paris.
Water Supply And Sanitation Bills As A Share Of Disposable Income Source: OECD (2010). Pricing Water Resources And Water And Sanitation Services, ENV/EPOC/GSP(2009)17/FINAL, Paris.
How Canada Fares: Meaningful Prices But… again, improving over time… Source: Environment Canada (2008). Municipal Water Pricing Report (2004 Statistics), available at www.ec.gc.ca/Water/en/manage/data/e_MUP2008.pdf.
If the price signal is correct… the majority of people and organizations will change they way they value water and change their behaviour – when using water and when buying water-using technologies – because they recognize that efficiency and conservation will save them money
VS. $428+HST $748+HST
A tale of two cities… * Saanich wastewater charges are based on winter consumption
Payback period: 12.7 years* Payback period: 6.8 years* * Based on marginal cost of Amana basic model front loader vs. basic model top loader; factors in volumetric energy, water and wastewater costs
Potential Impacts of Water Under-Pricing Higher operating costs Higher capital costs over the long term Unnecessary environmental impacts Reliance on less efficient tools to curb excessive consumption Fairness: those who waste pay similar charges to those who conserve Stifled innovation
Revenues And Expenditures Of Canadian Municipal Water Agencies: 1988 To 2007 Source: Renzetti, Steven (2009). Wave of the Future: The Case for Smarter Water Policy, C.D. Howe Institute Commentary, No. 281, February 2009, p. 2.
How Much Revenue Do You Need? Determined by Full Cost Accounting All the costs that a utility incurs are recorded and reflected in prices. Operations and maintenance; Administration; Overhead; Financial costs (depreciation, debt servicing, etc.); Capital costs; Regulatory costs… And sometimes... Soft costs Environmental externalities
It is not just about the price going up … In fact, the total spent need not necessarily increase BUT thepricing structure really matters …
The responsiveness of the quantity demanded of a good or service to a change in its price Price Demand Price Elasticity of Demand
Setting the Rate: Some Factors to Consider • Likely impact of price change on community • Price structure currently in place • Impact on existing business systems • How you will go about communicating the change to residents • The marginal cost of supplying water
Connection Charge + Variable (Per Unit) Charge Total Bill Setting the Rate
The Great Rate Debate Uniform vs. Inclining Block Rates
Some Other Special Types of Rates • Excess Use Rate • Seasonal Surcharges • Distance Rates • Scarcity Rates • Lifeline Block
Setting the Rate: The Key Factor Does the price accurately inform consumers about the costs of their water use and provide a signal that is sufficient to affect their decision making?
The “Top 3” Challenges Impacts on Low Income Families Revenue Stability Political Resistance
Mitigating Impacts on Low Income Families • Provide “lifeline blocks” • Targeted rebates and giveaways • Non-financial tools (e.g. education) • In some cases, subsidize (e.g. through levy on very high consumption) Remember: all families get more control over their costs when price is linked to consumption
Water Supply And Sanitation Bills As A Share Of Disposable Income: Lowest Decile of Population Source: OECD (2010). Pricing Water Resources And Water And Sanitation Services, ENV/EPOC/GSP(2009)17/FINAL, Paris.
Use innovative pricing mechanisms (e.g. rolling average pricing) • Use of two part system (fixed and variable charges) can smooth revenue variability • Senior government support • Careful planning goes a long way (e.g. research on price elasticity, local conditions) Revenue Stability
Political Resistance • Often motivated by fear that there will be “winners and losers” • Exacerbated by a long history of water underpricing in Canada • Consistently deliver the key messages in carefully planned communication
The Key Messages • This makes sense from both financial and environmental perspectives. • The negative consequences for communities can be easily mitigated (e.g. impacts on low income families) • Individuals and families can have greater control over their costs. • The objective is to cover the full costs of providing water services and no more. Someone ultimately has to pay these costs. • Revenue is reinvested in repairing aging infrastructure and protecting water sources - this is about investing in communities. • Improved pricing provides a much stronger incentive to innovate. • Many other places are successfully doing it.
Key Steps on The Journey • Have a plan • Consider implications for billing systems • Get metered and charge by volume • Improve water use accounting • Fully account for expenditure • Consider starting with seasonal surcharges • Make it part of a complete program • Recruit the aid of senior government