Download
1 / 45
450 likes | 462 Vues
Computing in High Energy Physics. John Apostolakis SoFTware for Physics Group, EP Dep, CERN. V1.0 201 6 .0 2 . 10. John.Apostolakis@cern.ch. Outline. Uses of Computers Data Acquisition – record R econstruction : Online, and off-line S imulation D ata analysis Size of challenge

E N D
Computing in High Energy Physics John Apostolakis SoFTware for Physics Group, EP Dep, CERN V1.0 2016.02.10 John.Apostolakis@cern.ch
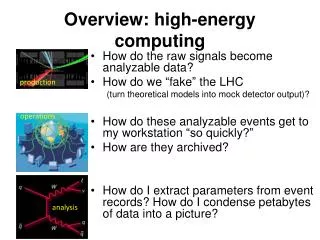
Outline • Uses of Computers • Data Acquisition – record • Reconstruction: Online, and off-line • Simulation • Data analysis • Size of challenge • the GRID solution and its other applications J. Apostolakis
Data Acquisition (DAQ) • Convert analog electronic signals into digital data • Trigger – decision to record • Find interesting coll. • Assess – do they meet selection criteria J. Apostolakis
Reconstruction A lightning introduction
The Reconstruction challenge J. Apostolakis
Online and offline reconstruction • Are collisions first-tagged really interesting enough to keep (given capacity constraints)? • Online reconstruction – seek to reconstruct ‘as much as you can’ quickly to enable decision • Critical part of experiment – collisions which are not recorded are lost • Later there is more time to reconstruct the contents of a collision – but this is also complex J. Apostolakis
What is reconstruction • Tracker hits form a puzzle • Whichtracks created them? • Each energy deposition is a clue • There are thousands of measurements in each snap-shot • The experiment’s reconstruction must obtain a solution! • In well measured magnetic field • Matches the traces to tracks J. Apostolakis
How it works – a simple example Start with the locations of the traces on first two planes Magnetic field Β J. Apostolakis
Reconstruction in practice Μαγνητικο Πεδιο Β Start with the locations of the traces on first two planes Try different combinations Project to subsequent planes Calculate differences between measured positions and ‘predictions’ (Kalman filter) J. Apostolakis
Reconstruction: result Start with the locations of the traces on first two planes Try different combinations Project to subsequent planes Calculate differences between measured positions and ‘predictions’ Finally the candidate tracks are identifed else look ‘quickly’ for the straight(er) ones – high energy tracks P= 11 GeV/c Μαγνητικο Πεδιο Β P= 22 GeV/c P= 7.5 GeV/c J. Apostolakis
Simulation and Detectors What is simulation ? Why it exists ? How is it done ?
Today’s detectors • Many different parts • Different capabilities • Measuring Location (trackers) • Measuring energy (calorimeters) • Due to complexity • Different materials, • Most studies must use computers to create samples of tracker hits & energy deposition ALICE Exp. J. Apostolakis
Today’s detector Technologies: ATLAS J. Apostolakis
What is simulation ? • We build models • Detector’sGeometry • Shape, Location, Material • Physics interactions • All known processes • Electromagnetic • Nuclear (strong) • Weak (decay Silicon Tracker 2.5 MeV e- σtotal = Σ σper-interaction electron J. Apostolakis 300 μ
Describes a Detector Hierarchy of volumes Many volumes repeat Volume & sub-tree Up to millions of volumes for LHC era Import detectors from CAD systems Navigates in Detector Locates a point Computes a step Linear intersection Geant4 geometry: what it does J. Apostolakis
Physics processes • Physics processes are modelled • For example Electromagnetic processes include: • Gammas: • Gamma-conversion, Compton scattering, Photo-electric effect • Leptons(e, m), charged hadrons, ions • Energy loss (Ionisation, Bremstrahlung) or PAI model energy loss, Multiple scattering, Transition radiation, Synchrotron radiation, • Photons: • Cerenkov, Rayleigh, Reflection, Refraction, Absorption, Scintillation • High energy muons and lepton-hadron interactions J. Apostolakis
A simple particle shower • In lead many secondary particles are produced • Most are contained • A few escape into CO2 • Energy deposition is measured in gas • Charged tracks ionise gas • Fewer new tracks produced PbCO2PbCO2 GEANT 3 J. Apostolakis
Example detailed geometry J. Apostolakis
Atlas : Physics Signatures and Event Rates • Beam crossing rate 40 MHz • sinelastic = 80 mb • In each beam crossing (rising each year,in 2012 ~ 25 interactions) • Different physics ‘targets’ • Higgs Boson(s) (Discovery 2012) • Supersymmetric partner particles • Unexpected • Matter-antimatter differences (B mesons) • Many examples of each channel are simulated J. Apostolakis
Why simulate ? • To design detectors • Decise details • To prepare the reconstruction • Before the detector is built and operates • To understand events in the analysis J. Apostolakis
Data Analysis J. Apostolakis
Data Analysis • Uses the results of Reconstruction • the products are reconstructed tracks, Energy deposits (calorimeters) • Hierarchy of data from original (RAW), to summary(AOD) • An experiment’s physics teams use (large) pool of data • Not in one central location, but in multiple locations (cost, space of building, computers, disks) .... using the GRID • The ROOT tool / framework used for analysis • https://root.cern.ch// • Hypatia:a small part of analysis for a school setting • Introduction /Portal • http://hypatia.iasa.gr/en/index.html • http://indico.cern.ch/conferenceDisplay.py?confId=257353#2013-07-08 J. Apostolakis
HEP Processing stages and datasets event filter (selection & reconstruction) detector processed data Event Summary Data (ESD) raw data batch physics analysis event reconstruction Analysis Object Data (AOD) (extracted by physics topic) event simulation individual physics analysis J. Apostolakis
Data Hierarchy RAW Raw data (DAQ) Detector digitisation 109 events/yr * 2 MB =2 PB/yr ~2 MB/event ESD First reconstruction data Pattern recognition information: Clusters, track candidates ~100 kB/event Physical information: Transverse momentum, Association of particles, jets, (best) id of particles, AOD Summary data for analysis ~10 kB/event TAG Classification information Relevant information for fast event selection ~1 kB/event J. Apostolakis
RAW ESD AOD AOD versions Event Event Event Event Phys Phys Raw Rec MyTrk Cand Tracks Velo Calo Coord Private Collaboration Data Event Data • Complex data models • ~500 structure types • References to describe relationships between event objects • unidirectional • Need to support transparent navigation • Need ultimate resolution on selected events • need to run specialised algorithms • work interactively • Not affordable if uncontrolled J. Apostolakis
Run Data Event 1 Event 2 … Event 3 Run Data Event 1 Event 2 … Event 3 Run Data Event 1 Event 2 … Event N Run Catalogue Physics : Run 21437 MC: B -> π π MC: B -> J/Ψ (μ+ μ-) … Dataset Event 1 Event 2 … Event 3 Dataset Event 1 Event 2 … Event 3 Event tag collection Tag 1 5 0.3 Tag 2 2 1.2 … Tag M 8 3.1 Collection Catalogue B -> ππ Candidates (Phy) B -> J/Ψ (μ+ μ-) Candidates … HEP Metadata - Event Collections Bookkeeping J. Apostolakis
Version Time VDET alignment HCAL calibration RICH pressure ECAL temperature t1 t2 t3 t4 t5 t6 t7 t8 t9 t10 t11 Data Item Time = T Detector Conditions Data • Reflects changes in state of the detector with time • Event Data cannot be reconstructed or analyzed without it • Versioning • Tagging • Ability to extract slices of data required to run with job • Long life-time Version Tag1 definition Time J. Apostolakis
LCG depends on two major science grid infrastructures …. EGEE - Enabling Grids for E-Science OSG - US Open Science Grid
Applications • Many applications in different domains • High Energy Physics (Pilot domain) • Experiments at CERN (LHC), DESY, Fermilab • Biomedical (Pilot domain) • Bioinformatics • Medical imaging • Earth Sciences • Geo-surveying • Solid Earth Physics • Hydrology, Climate • Computational Chemistry • Fusion • Astronomy • Cosmic Microwave Background • Gamma ray astronomy • Geology • Industrial Applications J. Apostolakis
Backup More on simulation
Applications beyond HEP • Biomedical Bioinformatics • Medical imaging • Earth Sciences • Geo-surveying • Solid Earth Physics • Hydrology, Climate • Astronomy • Cosmic Microwave Background • Gamma ray astronomy • Computational Chemistry • Fusion • Geology • Industrial Applications J. Apostolakis
Propagating in a field Charged particles follow paths that approximate their curved trajectories in an electromagnetic field. • It is possible to tailor • the accuracy of the splitting of the curve into linear segments, • the accuracy in intersecting each volume boundaries. • These can be set now to different values for a single volume or for a hierarchy. J. Apostolakis
Shower profile 1 GeV electron in H2O G4, Data G3 • Good agreement seen with the data J. Apostolakis
Antiproton annihilation - CHIPS Model neutron π K triton deuteron proton He-3 He-4 J. Apostolakis M. Kossov
Simulation ‘packages’ • Provides the means to simulate • the physical processes and • detector response of an experiment. • As was realised by many in the past, • most of the parts needed can be common between experiments (eg physics, geometry blocks) . • So it makes eminent sense to create and use a general purpose package • That includes the common parts, • And enables an experiment to describe those parts with are specific to it. J. Apostolakis
X-Ray Surveys of Asteroids and Moons Cosmic rays, jovian electrons Solar X-rays, e, p Geant3.21 ITS3.0, EGS4 Courtesy SOHO EIT Geant4 Induced X-ray line emission: indicator of target composition (~100 mm surface layer) C, N, O line emissions included ESA Space Environment & Effects Analysis Section J. Apostolakis
Other experiments Other experiments LHC LHC Moore’s law CERN Centre Capacity Requirements for all expts.(made July 2003) J. Apostolakis
CERN Lab m Uni x 2.5 Gbps 622 Mbps regional group Uni a CERN Tier 1 FNAL RAL IN2P3 UK Lab a USA France Tier 1 Tier3 155 mbps Uni n 155 mbps ………. Italy 622 Mbps Tier2 Desktop Germany ………. Lab b Lab a Uni b Lab c Uni n Lab c physics group Uni y Uni b A Multi-Tier Computing Model Tier 0 (Experiment Host lab) Tier 1 (Main Regional Centres) Tier2 Tier 3 Desktop User View Manager View J. Apostolakis
Distributed Analysis – the real challenge • Analysis will be performed with a mix of “official” experiment software and private user code • How can we make sure that the user code can execute and provide a correct result wherever it “lands”? • Input datasets not necessarily known a-priori • Possibly very sparse data access pattern when only a very few events match the query • Large number of people submitting jobs concurrently and in an uncoordinated fashion resulting into a chaotic workload • Wide range of user expertise • Need for interactivity - requirements on system response time rather than throughput • Ability to “suspend” an interactive session and resume it later, in a different location • Need a continuous dialogue between developers and users J. Apostolakis