Download
1 / 18
180 likes | 306 Vues
Development of the Global Historical Climatology Network Sea Level Pressure Data Set (Version 2) David Wuertz, Physical Scientist Climate Analysis Branch. N ational C limatic D ata C enter. Why Version 2 and why now?. 10 years since Version 1 was updated

E N D
Development of the Global Historical Climatology Network Sea Level Pressure Data Set (Version 2) David Wuertz, Physical Scientist Climate Analysis Branch National Climatic Data Center
Why Version 2 and why now? • 10 years since Version 1 was updated • Version 1 was not subjected to rigorous quality control • Wish to validate models and other data sets • Desire to pursue other research questions
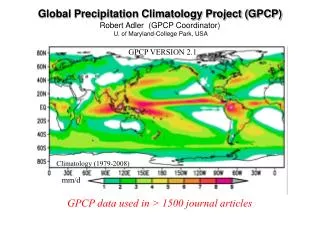
Data Sources for GHCN SLP • Electronically available sources only • World Weather Records • World Monthly Surface Station Climatology • Australian Bureau of Meteorology • Monthly Climatic Data for the World (includes CLIMAT messages via GTS)
Process Overview • Merge individual data sources • Eliminate Duplicates • Resolve remaining metadata issues • Perform quality assurance checks • Not homogeneity adjusted (yet)
Merge individual data sources • Compare station data and metadata • Some stations combined (“mingled”) • Required exact match in period of overlap • Required excellent match in metadata • Some stations added as new • Created new station when could not combine • Close matches considered in duplicate elimination process
Eliminate Duplicate Stations • Part automated, part manual • Defining duplicate (“sameness”): • Floating tolerance – Values are “same” if • 0.1 mb if both have 0.1 resolution • 0.5 mb if A has 0.1 and B has 1.0 resolution • 1.0 mb if both have 1.0 resolution • Compute difference statistics: • Percent of overlap “same” • Number of runs of same values, longest run • Max diff, 90th, 75th, 50th, 25th, 10th percentiles, Min diff
Eliminate Duplicate Stations (Cont’d) • Reorder according to sameness • Examine statistics and metadata • Decide if duplicates • Most get “mingled” • Some remain marked as duplicates (e.g., cases where only 70% same) • Examine stations having similar names • Examine stations having same location • Check for transitivity violations • If A = B, and B = C, but A C! • Manually inspect and resolve
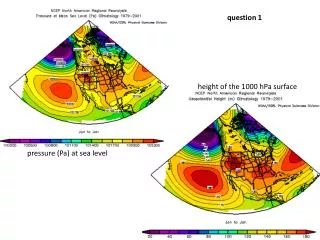
Resolve Remaining Metadata Issues • Assign correct country codes • Match with stations in other databases • (GHCN Precip, WMO Vol A) • Plot locations on high resolution map • Assign unique station numbers • Use WMO numbers wherever possible • For others use nearest WMO + unique modifier
Quality Assurance Checks • Suspect values saved in separate file • Manual inspection via plotting • Examine each time series • Examine difference series with neighbors • Look for mislocated or otherwise problematic stations (184 identified and removed) • Reasonable range check • Values outside range 860-1090 mb • (97 values involving 82 stations)
Quality Assurance Checks (Cont’d) • Gross errors using digital checks • Different years having largely the same data • (5 stations involved) • Runs of identical consecutive values • (71 runs involving 60 stations) • Runs of same value for a fixed month across all years (748 cases involving 459 stations)
Quality Assurance Checks (Cont’d) • Checks for statistically wild outliers • z scores based upon biweight mean and std dev • z scores > 5 flagged (298 points) • 3.5 < z scores < 5 flagged … • if neighbor’s z score < 3.5 (456 points) • Percent of data set flagged = 0.08%
Data Set Summary • Map of station locations • Period of record information • Comparison of GHCN and Hadley holdings • List of files for GHCN SLP v2 • How to obtain GHCN SLP v2 • Future SLP work
GHCN Pressure Stations (Nstations = 2668)
ObtainingGHCN SLP Files ftp ftp.ncdc.noaa.gov ftp> cd /pub/data/ghcn/v2 ftp> prompt ftp> mget *slp* ftp> bye
What next? • Compare with HadSLP, NCEP Reanalysis • Contribute to bigger and better AOPC Multinational SLP data set • Suggestions are welcome