Download
1 / 24
290 likes | 599 Vues
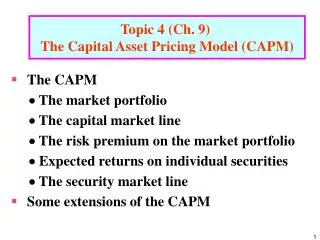
The Capital Asset Pricing Model (CAPM). The CAPM has A macro component explains risk and return in a portfolio context A micro component explains individual stock returns The micro component is also used to value stocks. The Capital Market Line. The capital market line

E N D
The Capital Asset Pricing Model (CAPM) • The CAPM has • A macro component explains risk and return in a portfolio context • A micro component explains individual stock returns • The micro component is also used to value stocks
The Capital Market Line • The capital market line • adds a risk-free return • redefines the efficient frontier
Risk and Return • The investor continues to select the portfolio that • offers the highest return for a given level of risk • maximizes satisfaction • Different investors may select different combinations of risk and return
Risk and Return • Different asset classes lie on the capital market line
Beta Coefficients • An index of risk • Measures the volatility of a stock (or portfolio) relative to the market
Beta Coefficients Combine • The variability of the asset’s return • The variability of the market return • The correlation between • the stock's return and • the market return
Beta Coefficients • Beta coefficients are the slope of the regression line relating • the return on the market (the independent variable) to • the return on the stock (the dependent variable)
Interpretation of the Numerical Value of Beta • Beta = 1.0 Stock's return has same volatility as the market return • Beta > 1.0 Stock's return is more volatile than the market return
Interpretation of the Numerical Value of Beta • Beta < 1.0 Stock's return is less volatile than the market return
High Beta Stocks • More systematic market risk • May be appropriate for high-risk tolerant (aggressive) investors
Low Beta Stocks • Less systematic market risk • May be appropriate for low-risk tolerant (defensive) investors
Individual Stock Betas • May change over time • Tendency to move toward 1.0, the market beta
Portfolio Betas • Weighted average of the individual asset's betas • May be more stable than individual stock betas
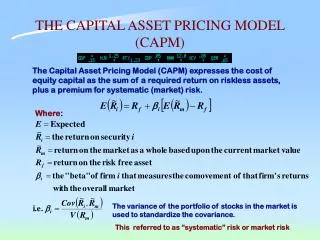
Beta Coefficients and The Security Market Line • The return on a stock depends on • the risk free rate (rf) • the return on the market (rm) • the stock's beta • the return on a stock:k= rf + (rm -rf)beta
Beta Coefficients and The Security Market Line • The figure relating systematic risk (beta) and the return on a stock
Arbitrage Pricing Theory (APT) • In the CAPM • a stock's return depends only on • the market return • the volatility of the stock (the beta) • APT is an alternative to the Capital Asset Pricing Model
Arbitrage • Buying in one market and simultaneously selling in another market to take advantage of price differentials • Assures there can be only one price • Assures that portfolios with the same risk will have the same returns
APT explains security returns in terms of • The expected return • A series of factors that may affect security prices • How the individual stock responds to unanticipated changes in those factors
Common Factors • Unexpected inflation • Unexpected changes in industrial production • Unanticipated shifts in risk premiums • Unanticipated changes in the structure of yields