Download

1 / 20
210 likes | 434 Vues
The Capital Asset Pricing Model. Review. Review of portfolio diversification Capital Asset Pricing Model Capital Market Line (CML) Security Market Line (SML). Capital Asset Pricing Model (CAPM). It is the equilibrium model that underlies all modern financial theory.

E N D
Review • Review of portfolio diversification • Capital Asset Pricing Model • Capital Market Line (CML) • Security Market Line (SML)
Capital Asset Pricing Model (CAPM) • It is the equilibrium model that underlies all modern financial theory. • Derived using principles of diversification with simplified assumptions. • Markowitz, Sharpe, Lintner and Mossin are researchers credited with its development.
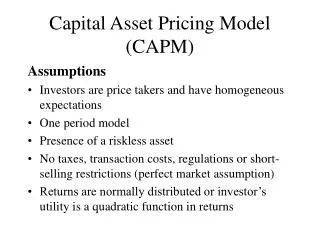
Assumptions • Single-period investment horizon. • Investors forecasts agree with respect to expectations, standard deviations, and correlations of the returns of risky securities • Therefore all investors hold risky assets in the same relative proportions • Investors behave optimally • In equilibrium, prices adjust so that aggregate demand for each security is equal to its supply
Market Portfolio • Since every investor’s relative holdings of the risky security is the same, the only way the asset market can clear is if those optimal relative proportions are the proportions in which they are valued in the market place • All investors will hold the same portfolio for risky assets – market portfolio.
Capital Market Line (CML) and the CAPM • CAPM says that in equilibrium, any investor’s relative holding of risky assets will be the same as in the market portfolio • Depending on their risk aversions, different investors hold portfolios with different mixes of riskless asset and the market portfolio • Example (online two stocks)
Capital Market Line E(r) CML M E(rM) rf m
Risk premium on the the market depends on the average risk aversion (A) of all market participants. Example: What determines the market risk premium?
Beta and Security Market Line • If risk is defined as the measure such that as it increases, a risk-averse investor would have to be compensated by a larger expected return in order for her to hold it in her optimal portfolio, then the measure of a security’s risk is its beta, b, not its standard deviation! b tells you how much the security’s rate of return changes when the return on the market portfolio changes
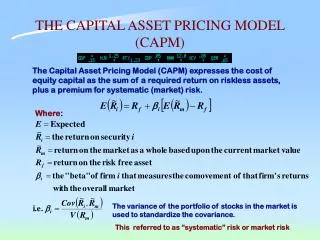
CAPM Risk Premium on any Asset • According to the CAPM, in equilibrium, the risk premium on any asset is equal to the product of • b (or ‘Beta’), and • the risk premium on the market portfolio
The Security Market Line • The plot of a security’s risk premium Eri-rf (or sometimes security returns) against security beta b is the security market line • Note that the slope of the security market line is the market premium • By CAPM theory, all securities must fall precisely on the SML (hence its name)
Security Market Line (SML) E(r) SML E(rM) rf b bM= 1.0
Security Market Line (SML) Relationships SML: ri = rf + i[E(rm) - rf] i= [COV(ri,rm)] / m2 Slope SML = E(rm) - rf = market risk premium
The Beta of a Portfolio in CAPM • When determining the risk of a portfolio • using standard deviation results in a formula that’s quite complex • using beta, the formula is linear
Examples for SML E(rm) - rf = .08 rf = .03 x = 1.25 E(rx) = .03 + 1.25(.08) = .13 or 13% y = .6 E(ry) = .03 + .6(.08) = .078 or 7.8%
Graph of Sample Calculations E(r) SML Rx=13% .08 Rm=11% Ry=7.8% 3% b .6 by 1.0 1.25 bx By
Disequilibrium Example E(r) SML 15% Rm=11% rf=3% b 1.25 1.0
Disequilibrium Example • Suppose a security with a of 1.25 is offering expected return of 15%. • According to SML, it should be 13%. • Under-priced: offering too high of a rate of return for its level of risk.
Alpha • Underpriced stocks plot above the SML • Overpriced stocks plot below the SML • The difference between the fair and actually expected rates of return on a stock is called the stock’s alpha. • Example: an alpha fund with alpha=1%, beta=0.5, standard deviation=0.15, market return=0.14, risk free rate is 0.06, market standard deviation=0.2