Download
1 / 29
290 likes | 376 Vues
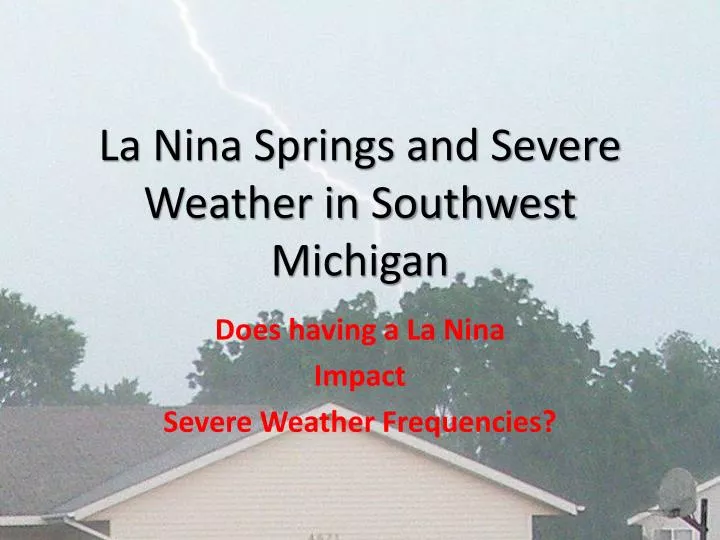
La Nina Springs and Severe Weather in Southwest Michigan. Does having a La Nina Impact Severe Weather Frequencies?. What We Will Look At. Tornadoes frequency since 1950 Trends of Tornadoes since 1950 Mean Number of Tornadoes by Phases of ENSO Tornado Frequency as a function of ENSO phase

E N D
La Nina Springs and Severe Weather in Southwest Michigan Does having a La Nina Impact Severe Weather Frequencies?
What We Will Look At • Tornadoes frequency since 1950 • Trends of Tornadoes since 1950 • Mean Number of Tornadoes by Phases of ENSO • Tornado Frequency as a function of ENSO phase • Severe storms by season for La Nina and El Nino • Severe Storms by Season for ENSO phase • Possible reason for difference in numbers by ENSO type • Mean Jet Stream for La Nina • El Nino in winter and spring
Tornado Trends Since 1950 All peak years for Tornadoes, since 1950, had a moderate or strong La Nina the preceding winter.
Tornado Trends • No statistically significant change in tornado numbers, by year since 1950 • There is an average of 12 years between peaks and minimums in yearly Tornado Number • Seems to be some relation to the NAO • NAO negative , tornadoes are more frequent • NAO positive , tornado numbers are suppressed • La Nina actually is a bigger player for increased tornadoes
Compare Mean ENSO for High and Low Numbers of Tornadoes La Nina
Tornadoes and ENSO • Now we will see if ENSO Phase makes any difference to tornado frequency • We will look at this by season for each phase of ENSO
Results • For La Nina, there is a statistically significant increase in tornado frequency at the 95 % confidence level • All of the peaks in tornado frequency since 1950 have been years with a moderate or stronger La Nina during the winter preceding the event • For La Nina we average about 8 tornados per season since 1950 • For El Nino we average around 5 per year since 1950
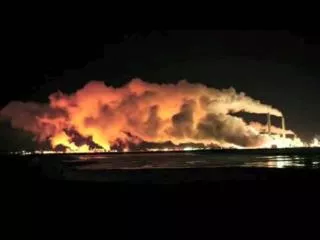
Now Let’s Consider Sever Storms in General • Does ENSO phase have an impact of severe storm frequency? • Does ENSO phase impact which season of the year severe storms are most prominent?
Severe Weather Trends • There is a statistically significant increase in severe storm frequency since the 1950’s to the past 10 years • Most of this increase is related to how we gathered the data • Different MIC’s had different methods to gather the data • Charles Snyder …1970’s and 1980’s • Dean Gulezian…..1990’s • Dan H. ……………..1996-2007 • Dan C. ……………..since @2007
Trends in Severe Storms Due to ENSO Phase • For both winter, spring, and summer La Nina has a significant increase in the numbers of events compared to El Nino • Average 6 more in the winter, compared to El Nino • Average 8 more in the spring, compared to El Nino • Average 10 more in the summer • Fall sees a suppression for both compared to ENSO neutral • For the entire season there is typically 24 more severe storm events during La Nina years
We will look at the 300 mb mean jet core for both La Nina and El Nino years
Moderate or Strong La Nina Winter Mean 300 mb Scalar Wind Speed
Moderate or Strong El Nino Winter Mean 300 mb Scalar Wind Speed
Moderate or Strong La Nina Spring Mean 300 mb Scalar Wind Speed
Moderate or Strong El Nino Spring Mean 300 mb Scalar Wind Speed
*Spring is March through May, but most of our severe storms are May through August *So, lets look at the jet core in May to see how far north it gets during a typical La Nina Spring*
Note the 850 mb jet location for May during Moderate La Nina’s
*It would seem this may be what we are looking for • The low level jet aimed at SW MI • The exit region of the polar jet is just to our NE
Conclusions • There is a statistically significant increase in severe storms and tornados during La Nina years • Seems the jet core is farther north in both the winter and spring during La Nina years • Since severe storms are typically related to high winds and jet level, it would make sense the Grand Rapids CWA would see more frequent severe storms during La Nina years than for El Nino year