Download
1 / 1
10 likes | 159 Vues
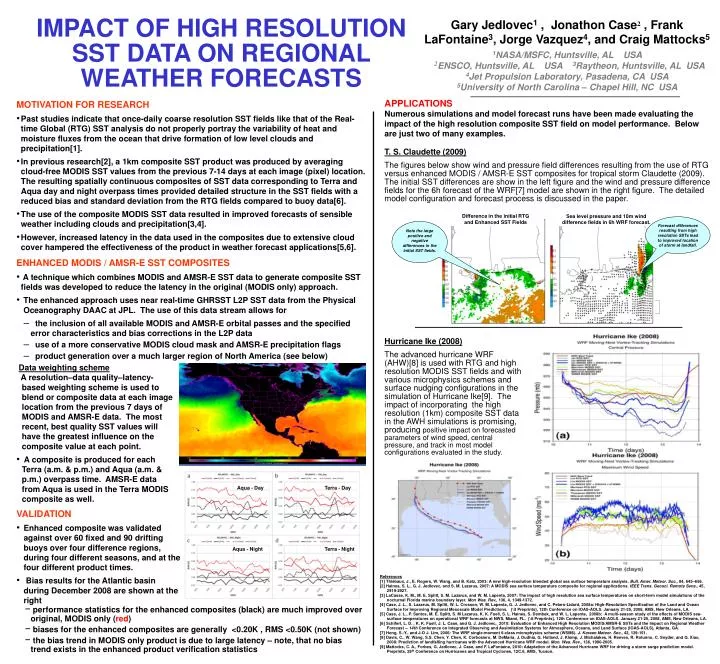
Figure 2. SST (left) and wind and pressure filed differences (right) between initial fields and control and high resolution forecasts for tropical storm Claudette. Difference in the initial RTG and Enhanced SST Fields. Sea level pressure and 10m wind difference fields in 6h WRF forecast.

E N D
Figure 2. SST (left) and wind and pressure filed differences (right) between initial fields and control and high resolution forecasts for tropical storm Claudette. Difference in the initial RTG and Enhanced SST Fields Sea level pressure and 10m wind difference fields in 6h WRF forecast. Aqua - Day Terra - Day Aqua - Night Terra - Night IMPACT OF HIGH RESOLUTION SST DATA ON REGIONAL WEATHER FORECASTS Gary Jedlovec1 , Jonathon Case2 , Frank LaFontaine3, Jorge Vazquez4, and Craig Mattocks5 1NASA/MSFC, Huntsville, AL USA 2ENSCO, Huntsville, AL USA 3Raytheon, Huntsville, AL USA 4Jet Propulsion Laboratory, Pasadena, CA USA 5University of North Carolina – Chapel Hill, NC USA • MOTIVATION FOR RESEARCH • Past studies indicate that once-daily coarse resolution SST fields like that of the Real-time Global (RTG) SST analysis do not properly portray the variability of heat and moisture fluxes from the ocean that drive formation of low level clouds and precipitation[1]. • In previous research[2], a 1km composite SST product was produced by averaging cloud-free MODIS SST values from the previous 7-14 days at each image (pixel) location. The resulting spatially continuous composites of SST data corresponding to Terra and Aqua day and night overpass times provided detailed structure in the SST fields with a reduced bias and standard deviation from the RTG fields compared to buoy data[6]. • The use of the composite MODIS SST data resulted in improved forecasts of sensible weather including clouds and precipitation[3,4]. • However, increased latency in the data used in the composites due to extensive cloud cover hampered the effectiveness of the product in weather forecast applications[5,6]. APPLICATIONS Numerous simulations and model forecast runs have been made evaluating the impact of the high resolution composite SST field on model performance. Below are just two of many examples. T. S. Claudette (2009) The figures below show wind and pressure field differences resulting from the use of RTG versus enhanced MODIS / AMSR-E SST composites for tropical storm Claudette (2009). The initial SST differences are show in the left figure and the wind and pressure difference fields for the 6h forecast of the WRF[7] model are shown in the right figure. The detailed model configuration and forecast process is discussed in the paper. Forecast differences resulting from high resolution SSTs lead to improved location of storm at landfall. Note the large positive and negative differences in the initial SST fields. • ENHANCED MODIS / AMSR-E SST COMPOSITES • A technique which combines MODIS and AMSR-E SST data to generate composite SST fields was developed to reduce the latency in the original (MODIS only) approach. • The enhanced approach uses near real-time GHRSST L2P SST data from the Physical Oceanography DAAC at JPL. The use of this data stream allows for • the inclusion of all available MODIS and AMSR-E orbital passes and the specified error characteristics and bias corrections in the L2P data • use of a more conservative MODIS cloud mask and AMSR-E precipitation flags • product generation over a much larger region of North America (see below) Hurricane Ike (2008) The advanced hurricane WRF (AHW)[8] is used with RTG and high resolution MODIS SST fields and with various microphysics schemes and surface nudging configurations in the simulation of Hurricane Ike[9]. The impact of incorporating the high resolution (1km) composite SST data in the AWH simulations is promising, producing positive impact on forecasted parameters of wind speed, central pressure, and track in most model configurations evaluated in the study. Data weighting scheme A resolution–data quality–latency- based weighting scheme is used to blend or composite data at each image location from the previous 7 days of MODIS and AMSR-E data. The most recent, best quality SST values will have the greatest influence on the composite value at each point. • A composite is produced for each Terra (a.m. & p.m.) and Aqua (a.m. & p.m.) overpass time. AMSR-E data from Aqua is used in the Terra MODIS composite as well. • VALIDATION • Enhanced composite was validated against over 60 fixed and 90 drifting buoys over four difference regions, during four different seasons, and at the four different product times. • Bias results for the Atlantic basin during December 2008 are shown at the right References [1] Thiébaux, J., E. Rogers, W. Wang, and B. Katz, 2003: A new high-resolution blended global sea surface temperature analysis. Bull. Amer. Meteor. Soc., 84, 645–656. [2] Haines, S. L., G. J. Jedlovec, and S. M. Lazarus, 2007: A MODIS sea surface temperature composite for regional applications. IEEE Trans. Geosci. Remote Sens., 45, 2919-2927. [3] LaCasse, K. M., M. E. Splitt, S. M. Lazarus, and W. M. Lapenta, 2007: The impact of high resolution sea surface temperatures on short-term model simulations of the nocturnal Florida marine boundary layer. Mon Wea. Rev., 136, 4, 1349-1372. [4] Case, J. L., S. Lazarus, M. Splitt, W. L. Crosson, W. M. Lapenta, G. J. Jedlovec, and C. Peters-Lidard, 2008a: High-Resolution Specification of the Land and Ocean Surface for Improving Regional Mesoscale Model Predictions. {\it Preprints}, 12th Conference on IOAS-AOLS. January 21-25, 2008, AMS, New Orleans, LA. [5] Case, J. L., P. Santos, M. E. Splitt, S. M Lazarus, K. K. Fuell, S. L. Haines, S. Dembek, and W. L. Lapenta, 2008b: A multi-season study of the effects of MODIS sea-surface temperatures on operational WRF forecasts at NWS, Miami, FL. {\it Preprints}, 12th Conference on IOAS-AOLS. January 21-25, 2008, AMS, New Orleans, LA. [6] Schiferl, L. D. , K. K. Fuell, J. L. Case, and G. J. Jedlovec, 2010: Evaluation of Enhanced High Resolution MODIS/AMSR-E SSTs and the Impact on Regional Weather Forecast -- 14th Conference on Integrated Observing and Assimilation Systems for Atmosphere, Oceans, and Land Surface (IOAS-AOLS), Atlanta, GA. [7] Hong, S.-Y., and J-O J. Lim, 2006: The WRF single-moment 6-class microphysics scheme (WSM6). J. Korean Meteor. Soc., 42, 129-151. [8] Davis, C., W. Wang, S.S. Chen, Y. Chen, K. Corbosiero, M. DeMaria, J. Dudhia, G. Holland, J. Klemp, J. Michalakes, H. Reeves, R. Rotunno, C. Snyder, and Q. Xiao, 2008: Prediction of landfalling hurricanes with the Advanced Hurricane WRF model. Mon. Wea. Rev., 136, 1990-2005. [9] Mattocks, C. A., Forbes, G. Jedlovec, J. Case, and F. LaFontaine, 2010: Adaptation of the Advanced Hurricane WRF for driving a storm surge prediction model. Preprints, 29th Conference on Hurricanes and Tropical Cyclones, 12C.6, AMS, Tucson. • performance statistics for the enhanced composites (black) are much improved over original, MODIS only (red) • biases for the enhanced composites are generally <0.20K , RMS <0.50K (not shown) • the bias trend in MODIS only product is due to large latency – note, that no bias trend exists in the enhanced product verification statistics