Download
1 / 64
640 likes | 776 Vues
DES Log (cont.). To view the DES log: Right-click in the Project Editor workspace and choose “Open DES Log” from the pop-up menu. This will provide information about the entire simulation.

E N D
DES Log (cont.) • To view the DES log: • Right-click in the Project Editor workspace and choose “Open DES Log” from the pop-up menu. This will provide information about the entire simulation. • Right click on a node or link and choose “Open DES Log”. This will provide information from the simulation log that applies only to this object.
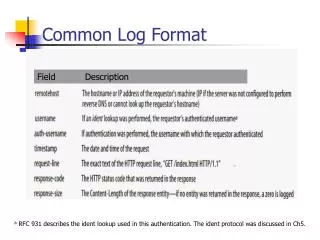
DES Log (cont.) Left clicking on a specific message gives details on the symptoms, causes, and suggestions. Filter the log to view only the fields or columns of interest.
Simulation Mechanics - Simulation Options • Duration • Time to simulate in the network model • May be shorter or longer than real time • Less discrete traffic = shorter real time for simulation to complete • Global attributes • Protocol specific • Control behavior of every applicable object • Sim efficiency modes: disable these for failure / recovery studies • Tracer packet options: determine how quickly flows reroute in failure case • Values Per Statistic • Increase number to increase granularity of statistics that use default bucket mode
DES Concept – Viewing Results • If simulation log reveals no errors that invalidate results, view results graphs on statistics you collected • Right-click on workspace / View Results • View list of node/link statistics in order from highest to lowest • Ex: View most utilized links • Right-click on workspace / Find Top Results • Compare results between multiple scenarios on same graph • Right-click on workspace / Compare Results
Results Options • Stacked Statistics • Overlaid Statistics
Results Options • Filters: • As is: every data point collected during sim • Average: average of several data points together • Use the Add button to add another stat to an existing panel • Ex: Add the average response time to a graph that shows As is response time
Find Top Results Click on a node and then click here to find the node within the topology
Lab 2: Goals • Build your first network • Review for anyone who has gone through the tutorials or IT Guru Quickstart • Teaches fundamentals of modeling workflow • Conceptual Goals in Project Editor • Building Topologies • Choosing Results • Running Simulations • Viewing Results • Traffic Preconfigured in this lab • The gray boxes you place in the workspace during the lab contain preconfigured application traffic
Lab 2: Building Your First Network • Lansing Hotel Reservation Services is a hotel reservation company headquartered in Dallas, Texas. • Lansing employees are experiencing high delays using the company’s proprietary hotel reservation application, and customers are threatening to use other services if the problem is not fixed. • Your task is to identify the problem and propose a solution. • Lansing’s current network consists of four offices, each containing 28 interconnected Dell workstations. The offices are connected via 56K lines. • The Application Servers, which all users access to run Lansing’s proprietary software (as well as other important applications), are located in the company’s Dallas HQ.
DES Workflow • One project can contain many scenarios • The Startup Wizard can be used to quickly and easily create new scenarios. • The Project workflow consists of: • Create/Import Topology/configuration • Use NetDoctor for configuration/topology/rules validation • Create/Import Traffic • Use Flow Analysis for capacity planning, routing, failure/recovery studies • Choosing statistics to be collected • Running simulation • Viewing results • Duplicating scenario • Running Simulation • Comparing results
Agenda • Tool Goals • Print Reports • Print Graphics • Capture Screen Images • op_vuanim Utility • Editing Preferences • Conceptual Goals • Exporting Data • Desktop Publishing • Animation • Preferences
Publishing Results • After building a model, running simulations, and analyzing results, you will often have to report the project to others. • It is important to organize, document, and archive the evolution and results of a continually changing model. • Modeler has several output options so you can create graphics, detailed reports, and output files.
Exporting Data • Modeler allows you to export the network topology in a variety of different methods. • Bitmap • EMA • HTML • Spreadsheet • Visio • XML
Exporting Data - Spreadsheets • User right clicks inside graph on desired panel. • Selects “Export Graph Data to Spreadsheet”. • Modeler launches the appropriate program with data.
Desktop Publishing • There are four types of operations for publishing OPNET information: • Printing model graphics • Capturing bitmap graphics • Export to HTML • Printing text files and contents of edit pads
Printing Model Graphics • Left-click on “File”, “Print…” or “Print All Subnets…”. • Specify Landscape as Portrait or Landscape
Capturing Bitmap Graphics • Left-click on “Topology”. • Select “Export Topology / To Bitmap …”. • Files are saved in <HOME>\op_admin\tmp. • Files can be saved as either: • GIF images (*.gif) • TIFF images (*.tiff, *.tif) • An example is shown on the following slides.
Exporting to HTML • Exporting to HTML will create screen captures of your network model and allow you to navigate the topology in a web browser. • Under the “Topology” menu, select “Export Topology”, then choose “To HTML…”. • Save the HTML files to the desired location.
Exporting to Spreadsheet • Exporting your network to a spreadsheet will provide a network summary that includes the type and number of links and nodes in your network model, and financial cost information. • Under the “Topology” menu, select “Export Topology”, then choose “To Spreadsheet…”. • Your default spreadsheet program will be launched with network summary data.
Printing Text Files • The description windows in OPNET can be saved to file and printed. • Select File / Print to print a description. • Examples: The information in these windows can be written to a user named text file or sent directly to a printer. Node description: Statistic description:
Animation • An animation can be viewed using the OPNET utility, op_vuanim. • This capability is valuable in better understanding the behavior of the model and it is an excellent tool for debugging models. • There are two types of animation in OPNET. • Automatic • Statistic
Animation - Automatic • Automatic animation displays node and packet movement. • This is an effective way to graphically depict the movement of traffic throughout your network. • To collect packet flow animation: • Open the desired project-scenario. • Enter the desired subnet. • Right-click on the project workspace and select “Record Animation.” • Run the simulation.
Animation - Statistic • Statistic animation allows you to view the statistics in a graph format as they are being collected. • In “Choose Statistics”, right-click the Statistic and select “Enable Animation”.
Animation • Open project, “anim_lab”. • Right click the project workspace and select “Record Animation.” • Configure the simulation for 50 seconds. • Run a simulation • From the “Results” pull-down menu, select “Play Animation” and wait for the Animation viewer to come up.
Edit preferences • Instructor demo: Instructor will demonstrate the edit preferences utility in OPNET.
mod_dirs Environment Attribute • OPNET maintains a list of model directories that determine which models can be accessed • This list of directories can be modified to allow you more flexibility in organizing your models • The “mod_dirs” attribute can be modified directly via Edit / Preferences • Model directories and subdirectories can be automatically added/deleted using the toolbar: File / Model Files • The first mod_dirs directory is called the “source directory” or “primary directory”. Any new model file is created there.
Error Log • OPNET maintains an Error Log that tracks any program errors that occur while OPNET is running • This Error Log can be a useful tool when debugging errors • Named err_log, can be found in the user’s op_admin directory • Technical Support might request your entire Error Log file
Agenda • Conceptual Goals • Objects available in the modeling domains • Data transfer between objects in a simulation • Network, node, and process models • Object attributes • Object naming paradigm • Role of packets in a simulation
Network Objects - Nodes Fixed • Node objects are represented by icons. Different icons may represent the same underlying object. Icons shown are the default icons. • A fixed node remains stationary during a simulation. • A mobile node changes position during a simulation, following an assigned trajectory or using vector based mobility (ground speed, bearing, and ascent rate). Trajectories can easily be created graphically in Modeler, or by ASCII text files. • A satellite node changes position during a simulation, following an assigned orbit. Modeler has supporting tools to create and view orbits. Mobile Satellite
Network Objects - Subnets • A subnetwork abstracts network components specified within it into a single object. • Subnetworks represent identical constructs in an actual network. Subnetwork
A point-to-point link transfers data between two fixed nodes. A bus link transfers data among many nodes and is a shared media. A wireless link, established during a simulation, can be created between any radio transmitter-receiver channel pair. Satellite and mobile nodes must use wireless links. Fixed nodes may use wireless links. A wireless link is not drawn but is established if nodes contain radio transceivers. Wireless link Network Objects - Links • Link objects model physical layer effects between nodes, such as delays, noise, etc.
Node Objects - Modules Processor • Modules are the basic building blocks of node models. Modules include processors, queues, transceivers, and generators. • Processors are the primary general purpose building blocks of node models, and are fully programmable. • Queues offer all the functionality of processors, and can also buffer and manage a collection of data packets. Queue
Transmitters and Receivers • Transmitters are the outbound interfaces between objects inside a node and communication links outside it. • Receivers are the inbound interface.
Transmitters and Receivers • Three types of transmitter and receiver modules correspond to different models of communication links. • Antennas may be used with radio transceivers to specify antenna properties. Point-to-point transceivers Bus transceivers Packet radio transceivers Antenna Transmitter Receiver Transmitter Receiver Transmitter Receiver
Module Connections • Packet streams carry data packets from a source to a destination module. • Statistic wires carry a single data value from a source to a destination module. In this case, hub_rx0 might report a packet reception to mac.
Sample Node Model ethernet_wkstn_adv Node Model • Node models support • Layering of protocol functions • Dynamic inter-module monitoring • Arbitrary node architectures • Definition of node classes through attribute promotion
Process Model Objects - States • The initial state is the place where execution begins in a process. • A forced state does not allow a pause during the process. • An unforced state allows a pause during the process. • Later chapters will fully discuss the differences between these types of states. Initial state Forced state Unforced state red green red
State Connections - Transitions • Transitions describe the possible movement of a process from state to state and the conditions allowing such a change. • Exactly one condition must evaluate to true. • If the condition statement (x == y) is true, the transition executive (Reset_Timers;) is invoked. Condition statement Transition executive
Executive blocks • Each state has two executive blocks • Enter executives are invoked on entering a state. • Exit executives are invoked before exiting a state.
Kernel Procedures - Introduction • KPs are pre-written functions that abstract difficult, tedious, or common operations. KPs free you from addressing memory management, data structure, handling event processing, etc. • All KPs begin with prefix “op_”. • KPs focus on communication modeling.
Distribution Package: op_dist_load () op_dist_outcome () Simulation and Event Packages: op_ev_cancel () op_sim_time () Kernel procedures • Sample of commonly used KPs Subq Package: op_subq_pk_insert () op_subq_pk_remove () Packet Package: op_pk_create () op_pk_create_fmt () op_pk_copy () op_pk_get () op_pk_total_size_get () op_pk_nfd_set () op_pk_nfd_get () op_pk_send () op_pk_send_delayed () op_pk_destroy () Interrupt Package: op_intrpt_schedule_self () op_intrpt_type () op_intrpt_strm () op_intrpt_code () ID, Topo and Internal Model Access Packages: op_id_self () op_topo_parent () op_topo_child () op_ima_obj_attr_get () Stat Package: op_stat_reg () op_stat_write () op_stat_local_read () op_stat_scalar_write () • Naming convention for Kernel Procedures - • op_<family name describing object >_<action> • When using process model editor, press ctrl-H for list of commonly used KPs.
What is Proto-C™ ? • Proto-C consists of • State transition diagrams • The complete C programming language • The library of OPNET Kernel Procedures (KPs) • State variables (private to each process) • Temporary variables
Object Attributes • Attributes are parameters of an object that can configure its behavior. • Attributes are dynamically changeable during simulation. • Processes have access to all object attributes. • Different attribute values allow objects of the same type to behave differently.
Object Attributes Though you use the same process model, by changing the data rate for the channel attribute you alter the behavior of the node.
Assigning Attribute Values • You can assign attribute values by right-clicking on an object and selecting or specifying the attribute value. • Attributes are of a certain type. Commonly used types are listed. Type Definition Integer Whole numbers: storage capacities; transmission window size Double Decimal numbers: processing speeds; timer values String General text info: statistic names, object names, options Toggle True/false condition: status flags, semaphores Typed file User defined file: routing tables, address mappings, script file Nested, complex data: routing table, circuit table, subqueues Compound
Promoting Attribute Values • You can “promote” an attribute. This means that you assign a value at a higher hierarchical level. • Passing control of a lower-level object to a higher level provides more flexibility in how objects are used. • You can leave an attribute unspecified at even the network level, and assign a value at run time.
Promoting Attributes Example • When an attribute assignment is made, promotion stops. An attribute value was assigned at mktg_lan, so the attribute does not appear in the object corporate. • Attribute names are used as prefixes at each new level of the object hierarchy. priority has been promoted from buf and set at mktg_lan corporate router.buf.priority: high mktg_lan buf.priority: promoted router priority: promoted buf