Download
1 / 19
200 likes | 333 Vues
MELS Project Wrap U p. Rich Brown , David Culler, Stephen Dawson-Haggerty , Steven Lanzisera , Jay Taneja Computer Science Division , University of California, Berkeley Environmental Energy Technologies Division, Lawrence Berkeley National Lab. MELS: Miscellaneous Electric Loads.

E N D
MELS Project Wrap Up Rich Brown, David Culler, Stephen Dawson-Haggerty, Steven Lanzisera, Jay Taneja Computer Science Division, University of California, Berkeley Environmental Energy Technologies Division, Lawrence Berkeley National Lab
MELS: Miscellaneous Electric Loads • Large, rigorous study of miscellaneous electric loads (mostly plugs) • Roughly 1/3 of building energy consumption • Difficult to study due to large number of small consumers • Test methods to accurately describe energy use of plug-in devices from individual device to whole building LBNL EETD Seminar Series
DOE MELS => Appliance Energy • 450 plug-load meters • 7 edge routers • 650m data points CPS-PI-11
Study Phases LBNL EETD Seminar Series
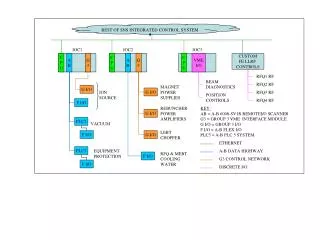
System Architecture • IPv6 tunnel from building network to data closet • Data in raw UDP • Configurable metering application LBNL EETD Seminar Series
Multipoint Calibration • Automated 20-point calibration on every meter • Generate a 3-part piecewise calibration • 90th percentile error is <2 watts across devices LBNL EETD Seminar Series
HYDRO Principles • Maintain multiple next-hop options • Trickelize density-sensitve state propagation • Horizontally scalable with multiple LBRs LBNL EETD Seminar Series
Emergent network dynamics • Verify dynamics results on large scale • Link and device churn are prevalent • Mean network degree is at least 16, diameter is about 4.5 hops LBNL EETD Seminar Series
Exploration is ongoing • Path length and router degree show clear diurnal and weekly variation • Exploration of new potential candidate links is a continuous process • With only “stable” links, diameter increases by factor of 2 LBNL EETD Seminar Series
Energy Analysis LBNL EETD Seminar Series
Can we identify when metered devices change over time? From data, found change from older 20” LCD to new 24” LCD Increase screen area 44%; reduce energy 33%.
How Common is Computer-Display Power Management? • 83% of monitors use power management • 15% use it with breaks for days at a time • 2% do not use it 40 Hour Work Week Rarely power down monitor PM w/ breaks
What is the Distribution of LCD Computer Display Energy Use? N=118
How Common is Desktop Computer Power Management? 39% rarely powered down 40 Hour Work Week 44% managed
How Much of Whole Building is Plugs? 40% of Building Electricity 3 month weekday average: March, April, May All Building Electricity All Plugs Note: no cooling during these months Projected based on full inventory and sample weights
What Makes Up Bldg 90 Plugs Energy? Timer controlled plug strips? 75 MWh/year 30% of non-computer plug total 6% of building total Computer power management? 150 MWh/year 60% of computer total 12% of building total Computers 50% of energy Task Lighting 7% Networking 6% Other 7% Misc. HVAC 10% of energy Displays 10% of energy Imaging 10% of energy
Findings and Next Steps • Bldg 90 network demonstrated large-scale, end-to-end WSN and collected a lot of useful data • IT equipment should be focus of office energy management programs • Using data for LBNL-wide plug-load management • Inventory and meter installation are labor-intensive • Exploring using public (homeowner & building occupant) participation for data collection • Integrate metering & communications into products • Robust sensor network needs more engineering • ? Evaluate commercial products now available • Electricity only part of buildings energy problem • Developing low-cost WSN for gas and water metering
Questions LBNL EETD Seminar Series