Download
1 / 43
430 likes | 558 Vues
Computing Random Effects Models in Meta-analysis. Terri Pigott, C2 Methods Editor & co-Chair Professor, Loyola University Chicago tpigott@luc.edu. As I am going through the beginning slides:. Please download RevMan if you do not already have it: http://ims.cochrane.org/revman/download

E N D
Computing Random Effects Modelsin Meta-analysis Terri Pigott, C2 Methods Editor & co-Chair Professor, Loyola University Chicago tpigott@luc.edu
As I am going through the beginning slides: • Please download RevMan if you do not already have it: • http://ims.cochrane.org/revman/download • Data is here: https://my.vanderbilt.edu/emilytannersmith/training-materials/
Fixed and Random Effects Models in Meta-analysis • How do we choose among fixed and random effects models when conducting a meta-analysis? • Common question asked by reviewers working on systematic reviews that include a meta-analysis
Our goal today • Provide a brief description of fixed and of random effects models • Discuss how to estimate key parameters in the random effects model • Do sample computations to illustrate how to obtain the variance component when computing the mean effect size • Illustrate how to compute the random effects model in RevMan • Share resources for these methods for reviewers
An advertisement • Much of my own thinking on these issues has been clarified by the following sources: Borenstein, M., Hedges, L. V., Higgins, J. P. T., & Rothstein, H. R. (2010). A basic introduction to fixed effect and random effects models for meta-analysis. Research Synthesis Methods, 1, 97-111. Borenstein, M., Hedges, L. V., Higgins, J. P. T., & Rothstein, H. R. (2009). Introduction to meta-analysis. West Sussex, UK: John Wiley.
Our choice between the two models depends on: • Our assumption about how the effect sizes vary in our meta-analysis • The two models are based on different assumptions about the nature of the variation among effect sizes in our research synthesis
Fixed-Effect model • Borenstein et al. adopt the wording of fixed effect (no “s”) here because in a fixed effect model, we assume that the effect sizes in our meta-analysis differ only because of sampling error and they all share a common mean • Our effect sizes differ from each other because each study used a different sample of participants – and that is the only reason for the differences among our estimates
In a fixed-effect model • Note that the effect size from each study estimate a single common mean – the fixed-effect • We know that each study will give us a different effect size, but each effect size is an estimate of a common mean, designated in the prior picture as θ
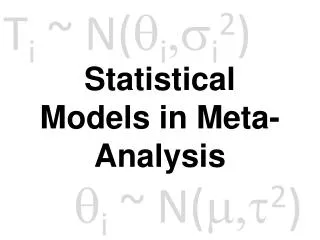
In a random effects model • We assume two components of variation: • Sampling variation as in our fixed-effect model assumption • Random variation because the effect sizes themselves are sampled from a population of effect sizes • In a random effects model, we know that our effect sizes will differ because they are sampled from an unknown distribution • Our goal in the analysis will be to estimate the mean and variance of the underlying population of effect sizes
In a random effects model • We see in the picture that each distribution has its own mean that is sampled from the underlying population distribution of effect sizes • That underlying population distribution also has its own variance, τ2 , commonly called the variance component • Thus, each effect size has two components of variation, one due to sampling error, and one from the underlying distribution
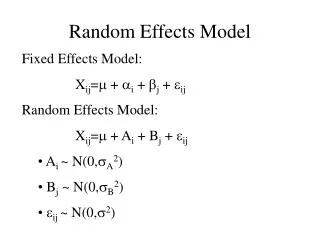
In fixed effects, we can write our model as So, each effect size estimates a single mean effect,θ, and differs from this mean effect by sampling error
In random effects, we can write our model as Each effect size differs from the underlying population mean, μ, due to both sampling error and the underlying population variance
Given the prior slides, how do we choose? • The fixed-effect model assumes only sampling error as the source of variation among effect sizes • This assumption is plausible when our studies are close replications of one another, using the same procedures, measures, etc.
Choosing a model (continued) • In the random effects model, we assume that our effect sizes are sampled from an underlying population of effect sizes • We already assume that our studies will differ not only because there are different participants, but also because of differences in the way studies were conducted • Thus, we often choose random effects models because we anticipate variation among our studies for a number of reasons
Implications of the choice • Recall that all our analyses in a meta-analysis are weighted by the inverse of the variance of the effect size, i.e., by the precision of the effect size estimate • For a random effects model, the variance for each effect size is equal to vi + τ2 • In other words, in a fixed effect model, we will more heavily weight larger studies. In a random effects model, the larger studies will not be weighted as heavily
So, where are we now? • We have discussed the underlying assumptions of fixed effect and random effects models • We have also talked about how we choose between the two models • Now we will talk about how to estimate the parameters of a random effects model
Review of steps for fixed effect basic meta-analysis • Compute the effect size and its variance for each study • Compute the study weight – the inverse of the variance (1/var) • Compute the weighted mean effect size and its standard error (inverse of the sum of the weights) • Compute the 95% confidence interval for the weighted mean • Compute the test of homogeneity
Goals in a basic meta-analysis using a random effects model • We want to estimate a mean effect size, μ, the mean effect size from the underlying population • We also want to estimate the variance of the underlying effect size distribution, τ2 • Biggest difficulty: how to estimate τ2
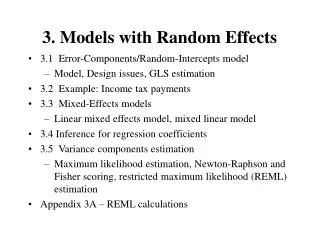
Estimating the variance component, τ2 • There are two main methods for computing τ2 • Variously called the method of moments, the DerSimonian/Laird estimate • Restricted maximum likelihood • The method of moments estimator is easy to compute and is based on the value of Q, the homogeneity statistic • Restricted maximum likelihood requires an iterative solution
Method of moments estimator This is the estimator used in many meta-analysis programs such as RevMan and CMA
An example • So before we do anything in our basic random effects meta-analysis, we need to compute Q and the fixed effects weights, wi= 1/vi , to get the variance component, τ2,. • Once we have our τ2 , we can continue with our computation of the mean effect size and its variance. • We will use an example of a meta-analysis of gender differences in transformational leadership
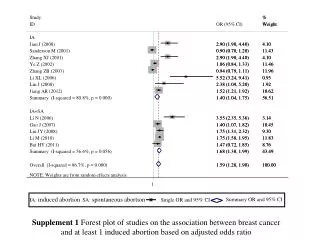
Eagly, Johannesen-Schmidt & van Engen (2003) • This synthesis examines the standardized mean difference estimated in primary studies for the difference between men and women in their use of transformational leadership. • Transformational leadership involves “establishing onself as a role model by gaining the trust and confidence of followers” (Eagly et al. 2003, p. 570). • The sample data is a subset of the studies in the full meta-analysis, a set of 24 studies that compare men and women in their use of transformational leadership
Back to our Method of moments estimator So we need c, and Q
To get c: ∑ wt - ∑ wt2/ ∑ wt = 1695.922 – (223238.2)/1695.922 = 1596.29 To get Q: 167.151-(-186.795)2 /1695.922 = 146.58 To get τ2: (Q – (k-1))/c = [146.58 – (24-1)]/1596.29 = 0.079
Now that we have τ2 , we need to get the mean and its variance • We first need to add τ2 to each study’s variance to get the random effects variance • Then we get the new weights to use for the computation of the mean effect size and its variance
Data The random effects mean is found from (-35.76)/223.00 = -0.16 The se for the mean is found by 1/sqrt(223.00) = 0.067
RevMan for random effects models • We can also get the results in RevMan without having to do the computations. • Open the file called “Gender differences for transformational leadership.rm5” – click on open a review from a file
These are the fixed effects CI’s for each study. This is the random effects mean and CI Here is our tau and test that tau is zero.
Once we have the random effects mean and CI • We will want to test whether the variance component is different from zero. • Testing whether the variance component is different from zero is equivalent to asking whether the variation among studies is greater than what we would expect with only sampling error • The test: the fixed effects test of homogeneity
Restricted maximum likelihood estimator • Many statisticians do not like the method of moments estimator though RevMan and Comprehensive Meta-analysis use this estimator • Can estimate τ2 using HLM, SAS Proc Mixed, or R • I can give you sample programs for these estimators
Reporting guidelines for random effects models • These are the reporting guidelines according to me • You should report the following when using a random effects model for estimating a mean effect size: • Rationale for choosing the random effects model • The method for computing the variance component, τ2(and it’s okay to say you used RevMan or CMA, for example) • The estimate of the variance component • The mean effect size and its variance or standard error • The confidence interval around the effect size
Some concluding remarks • Given the anticipated differences among studies in a typical social science systematic review, we usually choose random effects models • From the C2 Methods Editor (me): make sure to provide a rationale for your choice in the protocol, based on your substantive knowledge of the area of the review • Many other issues not touched on in this talk and see the references following this slide
References Borenstein, M., Hedges, L. V., Higgins, J. P. T., & Rothstein, H. R. (2010). A basic introduction to fixed effect and random effects models for meta-analysis. Research Synthesis Methods, 1, 97-111. Borenstein, M., Hedges, L. V., Higgins, J. P. T., & Rothstein, H. R. (2009). Introduction to meta-analysis. West Sussex, UK: John Wiley. Eagly, A. H., Johannesen-Schmidt, M. C. & van Engen, M. L. (2003). Transformational, transactional, and laissez-faire leadership styles: A meta-analysis comparing women and men. Psychological Bulletin, 129, 569-591. Raudenbush, S. W. (2009). Analyzing effect sizes: Random- effects models. In Cooper, H., Hedges, L. V. & Valentine, J. C. (Eds.). The handbook of research synthesis and meta-analysis (2nded). New York: Russell Sage Foundation.
P.O. Box 7004 St. Olavs plass 0130 Oslo, Norway E-mail: info@c2admin.org http://www.campbellcollaboration.org