Download
1 / 29
290 likes | 494 Vues
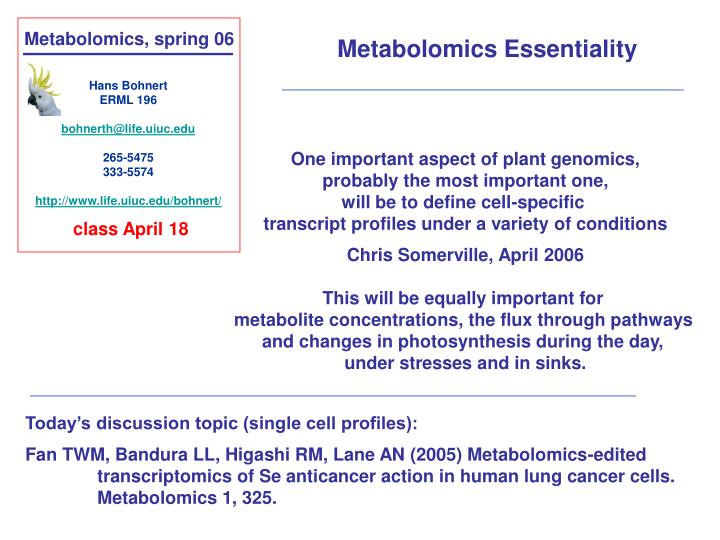
Hans Bohnert ERML 196 bohnerth@life.uiuc.edu 265-5475 333-5574 http://www.life.uiuc.edu/bohnert/. Metabolomics, spring 06. Metabolomics Essentiality. One important aspect of plant genomics, probably the most important one, will be to define cell-specific

E N D
Hans Bohnert ERML 196 bohnerth@life.uiuc.edu 265-5475 333-5574 http://www.life.uiuc.edu/bohnert/ Metabolomics, spring 06 Metabolomics Essentiality One important aspect of plant genomics, probably the most important one, will be to define cell-specific transcript profiles under a variety of conditions Chris Somerville, April 2006 This will be equally important for metabolite concentrations, the flux through pathways and changes in photosynthesis during the day, under stresses and in sinks. class April 18 Today’s discussion topic (single cell profiles): Fan TWM, Bandura LL, Higashi RM, Lane AN (2005) Metabolomics-edited transcriptomics of Se anticancer action in human lung cancer cells. Metabolomics 1, 325.
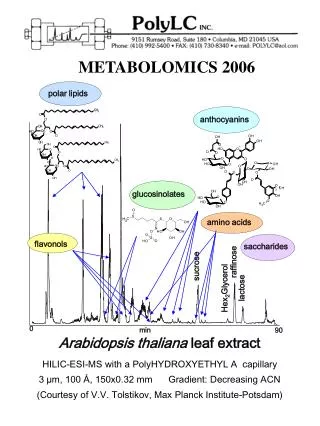
Metabolites Col 21 CO2/ P- ambient value fold change glutamic acid 0.39 0.00 threonine 0.61 0.11 Total 0.56 0.02* citric acid 0.73 0.05 malic acid 0.77 0.10 p-hydroxybenzoic acid 0.55 0.09 Total 0.86 0.07* maltose 1.55 0.09 trehalose 0.80 0.31 Total 1.08 0.53 mannitol 1.33 0.11 glycerol 0.87 0.23 inositol 0.96 0.84 Total 0.97 0.74 glucose-6-P 0.55 0.10 phosphate 0.71 0.24 Absolute change and Confidence Amino acids Thimm et al. (2004) Mapman: a user- driven tool to display genomics data sets onto diagrams of metabolic pathways and other biological Processes. Plant Journal 37, 914. Usadel et al. (2005) Extension of the visualization tool MapMan to allow statistical analysis of arrays, display of corresponding genes, and comparison with known responses. Plant Physiol. 138, 1195. Organic acids Sugars Alcohols In total ~60 metabolites could be scored
all metabolites • biological repeats • scale according to • factors analyzing • similarity in the • response • The chosen example • explains >90% of the • variability Linear discriminant analysis, LDA (Catchpole et al., 2005) Supplemental Figure 5.
June 27 6 carbon sugars 12 carbon sugars Organic acid Sugars 18 carbon sugars up down early, up late Metabolite changes (major categories) over time points June 21 up early down late down Amino acid Polyols Col-0 Cvi-0 Figure 6.
Cook et al. (2004) A prominent role for the CBF cold response pathway in configuring the low-temperature metabolome of Arabidopsis. PNAS 101, 15243. Effect of cold treatment on the Arabidopsis metabolome
CBF3 confers metabolic signatures in non-acclimated plants similar to that in acclimated plants Low temperature and Cvi
Catchpole et al. (2005) Hierarchical metabolomics demonstrates substantial compositional similarity between genetically modified and conventional potato crops. PNAS 102, 14458. We show that, apart from targeted changes, these GM potatoes in this study appear substantially equivalent to traditional cultivars. PCA LDA (Df1 vs. Df2 Df2 vs. Df3) • metabolite fingerprints • GC-TOF-MS • potato cultivars • GMOs (SST & SST/FFT) • fructan 1-fructosyl- • transferase • matrix presentation of • sample frequency in • predicted/observed • diagram fashion • most differences in • fructan polymerization • “substantial • equivalence”
Overlaid single-ion chromatograms potato diagrams vs. sample of different degree of polymerization of fructans (fructose polymers, n >10) GC-TOF-MS of m/z 217 in cultivars Desiree (= precursor for GMO) lacks kestose – which is present in GMO SST & SST/FFT
NMR • Absorption by nuclei [not electrons] of electromagnetic radiation (up to ~900 MHz) • Certain nuclei with spin and magnetic moment split energy levels in a field • The split is characteristic of the nucleus and the bonds in which it is involved • Continuous wave (CW) and pulsed (Fourier-transformed, FT) spectrometers • http://en.wikipedia.org/wiki/Nuclear_magnetic_resonance
What NMR signals mean chemical shift imprinted by neighboring nuclei characteristic for each bond compare signals with a library of known signals 1,3-butanediol two-dimensional (change field by 90o repeated scans at different frequencies) • quartet • doublet • triplet • triplet one-dimensional
Chemical shift is usually expressed in parts per million (ppm) by frequency, • because it is calculated from: • Sincethe numerator is usually in hertz, and the denominator in megahertz, • delta is expressed in ppm. • The detected frequencies (in Hz) for 1H, 13C, and 29Si nuclei are usually referenced • against TMS (tetramethylsilane), which is assigned the chemical shift of zero. • Other standard materials are used for setting the chemical shift for other nuclei. • The operating frequency of a magnet is calculate from the Larmor equation: • Flarmor = γ * B0, where B0 is the actual strength of the magnet • in units like teslas or gauss, and • γ is the gyromagnetic ratio ofthe nucleus being tested.
Fan, Bandura, Higashi & Lane (2005) Metabolomics 1, 325-339 Metabolomics-edited transcriptomics analysis of Se anticancer action in human lung cancer cells (META) Transcriptomic analysis is an essential tool for systems biology but it has been stymied by a lack of global understanding of genomic functions, resulting in the inability to link functionally disparate gene expression events. Using the anticancer agent selenite and human lung cancer A549 cells as a model system, we demonstrate that these difficulties can be overcome by a progressive approach which harnesses the emerging power of metabolomics for transcriptomic analysis. We have named the approach Metabolomics-edited transcriptomic analysis (META). The main analytical engine was 13C isotopomer profiling using a combination of multi-nuclear 2-D NMR and GC-MS techniques. Using 13C-glucose as a tracer, multiple disruptions to the central metabolic network in A549 cells induced by selenite were defined. META was then achieved by coupling the metabolic dysfunctions to altered gene expression profiles to: (1) provide new insights into the regulatory network underlying the metabolic dysfunctions; (2) enable the assembly of disparate gene expression events into functional pathways that was not feasible by transcriptomic analysis alone. This was illustrated in particular by the connection of mitochondrial dysfunctions to perturbed lipid metabolism via the AMP-AMPK pathway. Thus, META generated both extensive and highly specific working hypotheses for further validation, thereby accelerating the resolution of complex biological problems such as the anticancer mechanism of selenite. Key words (3-6) two-dimensional NMR; GC-tandem MS; 13C isotopomer profiling; selenite; lung adenocarcinoma A549 cells. Abbreviations 1H–13C HMBC: 1H–13C heteronuclear multiple bond correlation spectroscopy; 1H–13C HSQC: 1H–13C heteronuclear single quantum coherence spectroscopy; 2-D 1H TOCSY: two dimensional 1H total correlation spectroscopy; [U)13C]-glucose: uniformly 13C-labeled glucose; MSn: mass spectrometry to the nth dimension; MTBSTFA: N-methyl-N-[tert-butyldimethylsilyl]trifluoroacetamide; P-choline or PC: phosphorylcholine; PDA: photodiode array; TCA: trichloroacetic acid.
Knowledge: Se is an essential atom, high amounts affect (cancer) growth, Se in proteins is related to ROS homeostasis (somehow!) Experiment: The addition of Se to lung cells affects growth – what is the basis? Use genomics platforms (transcript analysis), GC-MS & esp. NMR Hypothesis: gene expression is altered, and metabolite analysis can be correlated with transcript changes – can it, is the question! Approaches Microscopy, NMR, GC-MS, transcripts
Se interferes with the cytoskeleton and mitochondrial activity Selenite effects proliferating cells; Selenite-rich diets may have anti-cancer applications.
Se leads to degradation of DNA TUNEL assay? control Se treated
* * High resolution 2D NMR spectra of control and Se-treated cells “1H chemical shift”
Metabolites with chemical shift indicative of changes 12C/13C and 1H connectivity Se-cells (13C-glc) spectral differences control/Se
GC-MS + NMR absolute amount labeled positions (12C-13C)
high resolution Control 1D Control 2D
down up *depletion 13C