Download
1 / 41
410 likes | 413 Vues
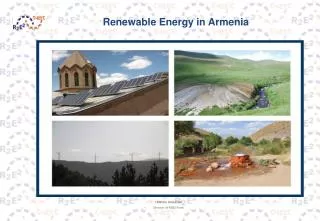
This project explores the investment requirements and benefits arising from energy efficiency and renewable energy policies in Armenia. It focuses on the development of the Armenian energy system and uses the MARKAL-Armenia Integrated Energy System Model. The project includes a reference scenario, alternative scenarios, and analysis results.

E N D
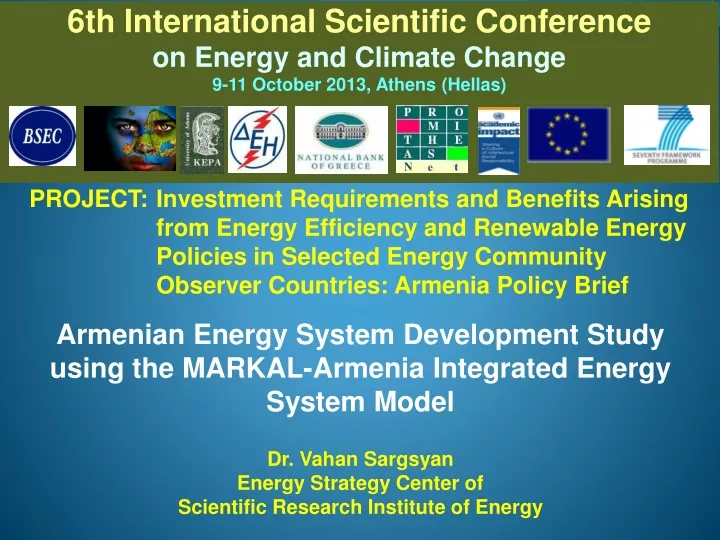
PROJECT: Investment Requirements and Benefits Arising from Energy Efficiency and Renewable Energy Policies in Selected Energy Community Observer Countries: Armenia Policy Brief Armenian Energy System Development Study using the MARKAL-Armenia Integrated Energy System Model Dr. Vahan Sargsyan Energy Strategy Center of Scientific Research Institute of Energy
Presentation Outline • Reference scenario assumptions • Reference scenario indicators • EE & RE analysis results • Alternative scenarios
Reference Scenario:Characterization • Governmental development strategies • Energy Sector Development Strategy in the Context of Economic Development in RA • Action Plan for the Ministry of Energy and Natural Resources of the RA Stipulated by the Provisions of the National Security Strategies of the RA • National Program on Energy Saving and Renewable Energy the RA • Renewable Energy Roadmap for Armenia • Sustainable Development Program • Law of Republic of Armenia on Energy, Law of Republic of Armenia on Energy Saving and Renewable Energy • Intergovernmental agreements • Electricity-Gas exchange • Implication of recent downturn on economic growth • Analyses of development in similar countries
Reference Scenario:Data Sources • National Statistical Service of RA • Public Services Regulatory Commission • ArmRusgasprom • Customs Services • Ministry of Energy and Natural Resources • Energy Development Strategy • National Saving Program • Sustainable Development Program • Second National Communication on Climate Change • Development of Renewable Energy Roadmap of RA • USAID reports • World Bank • International Energy Agency Expert estimations were done for the data gaps based on retrospective analyses and developments in similar countries.
Reference Scenario:Key Assumptions • Existing 400 MW nuclear plant retired in 2018* • New 1,000 MW nuclear unit comes online in 2021 • International electricity-gas exchange agreement with up to 6,900GWh/yr (in 2021) for export and up to 2.3 billion m3 gas for import • GDP average annual grow rate of 3.9%** • Population growth rate 6% from 2006 to 2030 • Number of people per household drops by 14% from 2006 to 2030 • Number of residential units increase by 23% from 2006 to 2030 • Automatic Efficiency Improvement (AEI) 0.01%/year • Demand Services Growth from 2006 to 2030 • Residential 37% • Commercial 87% • Industry 122% • Agriculture 23% * Subsequent to the analysis the GoA decided to extend the operating life of the existing plant, which will be reflected in future analyses. ** According to World Bank GDP growth rate increases from 1.25% in 2010 to 4.5% in 2015, then remaining at that level out till 2030.
Calibration of theEnergy Balance (2006) The national energy balance is decomposed to establish the 1st year and ensure proper calibration of the model.
Generation Capacity (MW) Nuclear Renewable power and Other plants, 407.5 power plants, 2.6 Gas - fired power plants, 860 Hydroelectric power plants, 1075 Primary Energy,Generation Capacity,Final Energy Consumption (2006)
Reference Scenario:Total Primary Energy Supply • Primary energy consumption in 2030 is projected to be 5,163Ktoe, increasing from 2006 levels by 95% • The most significant component of primary energy growth is the growth in nuclear energy, which increases from 25% to more than >33% of total primary energy (much of the electricity generated is designated for export). • Imports of natural gas allows gas to remain approximately 50% of total primary supply. • Oil product imports increase (transport sector), although the share in primary energy remains at the same level.
Reference Scenario:Energy Imports • Imports nearly double over the planning horizon, in proportion with the growth in primary energy • LPG imports decrease to none by 2021 • Nuclear fuel imports rise as the new plant comes online • Natural gas imports grow by 84% owing to the gas swap agreement
Reference Scenario:Electricity Sector Evolution • 687MW of thermal capacity already added (in 2012) on existing 810MW • After 400MW plant retires 1,000 MW of nuclear capacity adds (in 2021) • New Hydro capacity of 650 MW added which provides 1.8GWh electricity • 25MW of geothermal capacity added in 2021 • Electricity exports reach over 7 billion KWh in 2030 in accordance with the intergovernmental agreement regarding electricity/gas exchange (no exports on other directions)
Reference Scenario:Final Energy Consumption • Total final energy consumption grows 70% over the planning horizon • Share of natural gas in final energy rises from half to over 60% by 2030 • Electricity consumption increases by 40%
Reference Scenario:Natural Gas Consumption by Sector • Due to the increase of share of CNG vehicles gasoline consumption decreases by 44% • In 2018 the CHP plant is ramped up to produce more electricity, till the new nuclear plant comes online • In 2021 sharp drop is seen in power sector gas consumption, which is result of the new NPP coming online • Residential sector gas consumption almost doubles over planning horizon • Industrial gas consumption increases by 156%
Reference Scenario:Evolution of Expenditures • Additional 2,362 MW of new generation capacity requires total investment of 5.984€ billion • Fuel costs drop owing to the electricity-gas exchange which displaces Russian gas • Demand device have about a 15year lifetime, and thus existing devices must all be replace by 2021 Total investment expenditures for new power plants and devices are incurred as demand rises and existing power plants and devices reach the end of their operational lifetimes
Scenarios Considered Reference, Energy Efficiency, Renewable Energy and Combined EE&RE runs assume the building of a 1GW nuclear plant and an international electricity/gas exchange agreement are in place, the Country Specific scenarios are done without these assumptions.
Energy Efficiency Scenarios:Main Indicators • Energy Efficiency measures promotion (reducing barriers but without imposing a target) • Energy Efficiency target (based on National Energy Saving Program) • 8% reduction of 2006-2009 final energy consumption in 2021 (EE) • 17.4% reduction of 2006-2009 final energy consumption in 2021 • 26.7% reduction of 2006-2009 final energy consumption in 2021
Energy Efficiency Scenarios:Comparison – Net Energy System Cost(Change from Reference) • When barriers are lowered for the uptake of energy efficiency noticeable total system cost savings of 1.68% (385M€) is seen as a result of the 2.73% reduction in final energy achieved. • Due to EE promotion imports of energy go down by 2.97% (0.92Mtoe) • Meeting the EE -17.4% target results in larger energy savings – 3.49% of primary supply and imports (1,095 Ktoe) and nearly 4.01% of final energy – while still saving 1.56% (358M€) from the Reference scenario system cost • Forcing higher levels of reduction (EE -26.7%) in consumption are not economical, increasing total system cost by 2.44%, but decreasing imports by 6% (1,836 Ktoe)
Energy Efficiency Scenarios:Comparison – Final Energy Consumption(Change from Reference) • Main reductions come from more efficient use of natural gas and switching to very efficient electric appliances • Gas consumption over the planning horizon reduces by 2% in EE-8% target case, 9% in Average EE case, and 19% in Optimistic case • Noticeable reductions are seen in diesel fuel use (269Ktoe in 8% case)
Energy Efficiency Scenarios:Comparison – Sector Energy Consumption(Change from Reference) • The bulk of the consumption reductions occur in the residential (34%), industrial (37%), and commercial (23%) sectors • At 26.7% target reductions also occur in the transportation sector with a shift to more efficient busses and light duty diesel vehicles
Comparison of Scenarios:Main Indicators • EE 8% reduction in gross final energy consumption with EE promotion • RE16% share of Renewables in 2021 (According to Renewable Energy Roadmap) • EE&RE Targets combine energy efficiency and renewable energy goals
Comparison of Scenarios:Total Energy System Cost Over thePlanning Horizon (Change from Reference) • EE policies can save 358M€ or 1.56% compared to the Reference scenario • To achieve RE target without promoting EE costs an additional 71M€ or 0.31% • Combined policies result in achieving the RE target while still realizing an overall savings of 317M€
Renewable Energy Scenarios:Total Consumption of Renewables • RE target results in 282 MW of new wind capacity, which produces additional 296.4 GWh • In the Combined case added Renewable capacity (Wind+Solar) is 100MW less • Investments in the power sector grows by 5.4% (107M€) for RE alone, however when combined with EE costs decrease by 25M€ compared to the Reference
Comparison of Scenarios:Imports (Change from Reference) • Increased use of domestic RE resources reduces imports by 2.1% • As a result of EE target oil-products imports reduce by 8% (273Ktoe) • Natural gas imports decrease by 4-7% in different scenarios (1.1Mtoe in the Combined case)
Comparison of Scenarios:Competiveness Energy required per unit of GDP goes down in Reference by 32%, with an additional 5% drop in Combined case Energy System Expenditures and Savings (Change from Reference) Total Final Energy Consumption / GDP • Substantial fuel savings (in dark blue) can be seen under EE policies, reaching a cumulative reduction of 535M€ in the combined scenario • Spending on improved demand devices is compensated for by the fuel savings • Additional 108€M investment required to meet the RE target • The combined scenario achieves an overall savings of 207M€ per year by 2030
Comparison of Scenarios:CO2 Emissions • In the power sector emissions decrease by 15% (1550kt) in Combined scenario • Noticeable reductions are seen in residential (2-8%) and industry (6-9%) sectors (Change from Reference) • CO2 emissions grow 57% by 2030 reaching 6,000Gg per annum under the Reference scenario • Drop in 2021 by over 20% in all scenarios is a result of thermal generation sharp reduction due to nuclear generation increase • Growth ≈1.5 times in 2030 compared to 2006 explained by over 80% generation increase in gas-fired plants, and total gas consumption and other energy carriers use growth of >60% • Avoided CO2 by scenario: • EE: 2,589Gg, -6.15% • RE:1,422Gg, -3.38% • EE+RE: 3,178Gg, -7.55%
Policy Drivers for the Alternate Scenarios • No Nuke - where the current nuclear power plant closes after 2018, no new nuclear is built • No Nuke + EE -8% • No Nuke + Georgian Electricity Imports - the possibility of importing electricity from Georgia by means of an Armenian dedicated hydro plant (400MW plant able to come online in 2021) through a fixed contract arrangement, competing with the nuclear option • International electricity-gas swap is absent when no new nuclear plant
Main Observationfrom the Alternate Scenarios • The overall system cost increases, but only by at most 1.56% (358€ million over the 20 year planning horizon) • Less electricity exports lead to less thermal generation and reduction in natural gas consumption in the power sector • The possibility of increased electricity imports from Georgia reduces the costs to just 170M€ million {though this scenario needs additional analysis with further investigation of investment costs (including transmission line), seasonality of electricity production, etc.} • Alternatives to existing plans of 1,000MW nuclear and the electricity-gas swap can lead to decrease in overall CO2 emissions, ranging from 11.6% to 16.3%
Alternate Scenario ComparisonTotal Energy System Cost (Change from Reference) • Absence of a new nuclear plant and not electricity/gas exchange increase total system cost by 1.56% (358M€) • EE measures decrease difference between Reference and No Nuke by 292M€, down to less than 0.3% • Importing electricity from Georgia reduces by half the added cost without the nuclear plant, but it is still 0.74% (170M€) more than under the Reference scenario
Main Observations:Without New Nuclear nor Electricity/Gas Exchange • Electricity exports, according to international exchange agreement, mostly come from the nuclear plant, and in this case up to 96% of imported gas is received at no cost in 2021-2030 • Without electricity/gas exchange but with building a 1GW nuclear plant total system cost increase by 3.43% (788M€), so a robust electricity export market is critical • In the Reference need to import only 0.09-0.8billion m3/year of gas from Russia in 2021-2030, but without the nuclear plant and associated “exchange” gas Russia is the only source and 2.1-2.82 billion m3/year needs to be imported at market value • From 2021, when new nuclear plant comes online, the price for natural gas is so high that the electricity/gas exchange is equivalent of selling the electricity at 8.2 €cents and higher • Since the cost of producing electricity is substantially below these export prices the total system cost for the Reference scenario (with new nuclear and electricity/gas exchange) is lower than when these options are removed • *Gas price projections are done based on Georgian Markal Model
Alternate Scenarios Comparison:Energy System Expenditures and Savings(Change from Reference) • Fuel costs increase in all three scenarios, which is partly compensated by not incurring the cost of the new nuclear plant • With EE the fuel expenditure trend turns down towards the end of the modeling period, points to future savings
Alternate Scenario Comparison:Primary Energy(Change from Reference) • In the absence of the new nuclear plant and electricity/gas exchange there is significant reduction in total primary energy • Electricity imports increase in all 3 scenarios (1.3-1.7GWh), with Georgian hydro showing a doubling
Alternate Scenario Comparison:Electricity Generation • Electricity exports decrease till 2018 and there are no exports after that without the nuclear plant • Reference export commitment requires higher levels of gas-fired generation • Under the Georgian scenario there are electricity exports (0.2-0.5 billion kWh) • Without export electricity and less gas available generation from thermal plants goes down by over 1 billion kWh.
Alternate Scenario Comparison:New Capacity Additions • Without the nuclear plant to cover domestic electricity needs an additional 276MW thermal capacity is required, though only 80MW more with EE • Hydro capacity is less by 17MW without the nuclear plant and 25MW in EE, but is 494MW when considering taking the Georgia plant into consideration
Alternate Scenario Comparison:CO2 Emission(Change from Reference) • Most of the CO2 reduction occurs in the power sector as a result of less thermal generation (over 14% for Georgian scenario), since gas now expensive and less electricity exports • With EE Residential and Industry CO2 reductions reach 687Gg
Summary of Key Indicatorsfor the Armenia Energy Sector(2006-2030)
Alternate Scenario Comparison:Assessment of a Modular Nuclear Plant • Main assumptions are: • rather than forcing the building of a 1,000MW nuclear plant, from 2020 it is left to the model to build modular nuclear plant(s) with maximum capacity of 1,000MW • Investment cost for the modular reactors is 4755€/kW • the electricity-gas “swap” is absent (thus no forced electricity exports or inexpensive gas) • Main insight - this flexible nuclear scenario chooses a smaller unit (about 200MW) of nuclear capacity to cost-effectively meet domestic demand • Due to the absence of the “swap” total system cost 347M€ (1.51%) higher than the Reference scenario • Future analysis will look to examine modular nuclear plants together EE, RE, Georgian hydro, and other energy independency and security options
Thank You! Energy Strategy Center of Scientific Research Institute of Energy 5/1 Myasnikyan avenue, 0025 Yerevan, Armenia Phone/Fax: +374-10 559-664 E-mail: piuesc@energinst.am Vahan.sargsyan@energinst.am