Download
1 / 14
140 likes | 273 Vues
Waste Sector Uncertainties. Workshop on Uncertainties in Greenhouse Gas Inventories 5-6/9 2005. Rolf Adolfsson, Statistics Sweden. Institutional arrangements.

E N D
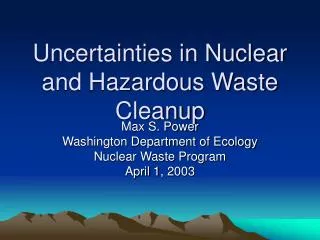
Waste Sector Uncertainties Workshop on Uncertainties in Greenhouse Gas Inventories 5-6/9 2005 Rolf Adolfsson, Statistics Sweden
Institutional arrangements • The GHG inventory is coordinated, on behalf of the Swedish Ministry of Sustainable Development, by the Swedish Environmental Protection Agency. • A consortium called Swedish Environmental Emissions Data (SMED), composed of Statistics Sweden, the Swedish Meteorological and Hydrological Institute (SMHI) and the Swedish Environmental Research Institute Ltd. (IVL), works on the collection of data and calculations of emissions for the following sectors: energy, industrial processes, solvents and other product use, agriculture and waste.
4A Methane emissions from landfills , Metanemissionen kan då formuleras som: Emission=(Gasproduction-recovered gas)*(1-oxidation).
Some comments on the method of calculation: • The multiplication of many terms may yield errors in the level of calculated emissions. • The formula is more complicated than A*EF=Emission. Uncertainty analysis according Tier 1 is difficult to apply. • The formula requires historical data, which does not exist, on waste. The lack of historical data contributes greatly to the error (especially for the base year 1990). • Historical data on waste can never be significantly improved. • Uncertainty in the estimate is reduced in time. This also implies difficulties in the application of uncertainty estimation according to Tier 1. • The base year will always be unreliable since the estimate is based on many assumptions. • Much information is required in order to apply uncertainty analysis according to Tier 2. • In order to estimate the above parameters with a great degree of certainty, repeated yet costly measurements of emissions are required.
Uncertainty estimation according to Tier 1 at an aggregated level
Rough appraisal” Generalised Tier 1” Preliminary uncertainty estimates for separate parameters Emission factors
Calculation of total uncertainty [1] G. Brånvall 2005 (*) The coefficient of variation is calculated given a triangular distribution (**) Calculated as 2*coefficient of variation
Other analyses • Sensitivity analysis • Tier 2
Improvements to uncertainty estimates, required for Tier 2 Activity data Improved data on the error in activity data needs to be collected, instead of using standard values. Surveys from recent years Errors can be categorized as: Sampling error Non-sampling errors: coverage error non-response error measurement error processing error Errors with extrapolation of waste quantities are greater We would need to analyse the relationship between the resulting waste and population size/value added since the relation affects the size of the error due to extrapolation
Errors with DOC estimates • DOC content is often based on screening inspections which are usually statistical investigations for which survey design may not have been thoroughly thought out. • One way to evaluate the quality of screening inspections is to compare collected quantities of waste which fall under producer responsibility. Errors with estimations of extracted amounts of methane
Further information needed for Tier 2 • Error in the emission factors • Correlations between errors • 1) Correlations within the model • 2) Correlations over time • Effect of different possible interpretation of IPCC's guidelines. • i. e. Application of MCF; How many half-life periods back in time should one require activity data for - 3, 4 or 5?
Literature and references • G. Brånvall: Some remarks on the IPCC document Quantifying Uncertainties in Practice. Statistics Sweden 2005. Draft