Download
1 / 46
470 likes | 765 Vues
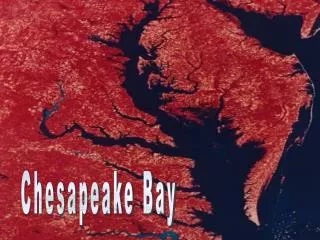
Water Quality and the Chesapeake Bay David O’Brien NOAA Fisheries Service Gloucester Point, VA. Chesapeake Bay. The nation’s largest estuary Nation’s most biologically diverse estuary; > 3600 species of plants and animals Over 17 million people live in the watershed.

E N D
Water Quality and the Chesapeake Bay David O’Brien NOAA Fisheries Service Gloucester Point, VA
Chesapeake Bay The nation’s largest estuary Nation’s most biologically diverse estuary; >3600 species of plants and animals Over 17 million people live in the watershed
Chesapeake Bay watershed Virginia Maryland Pennsylvania New York Delaware West Virginia Dist. Columbia
Development: Increased impervious surface Increased runoff Increased pollution Lower water table Evaporation Evaporation Decreased Less groundwater flow The Water Cycle Water-vapor transport Less vegetation, thus less evapotranspiration!! Infiltration Ocean Adapted from NEMO
Threats to the Chesapeake Bay NUTRIENTS SEDIMENTS TOXIC CHEMICALS HABITAT LOSS OVERFISHING
Chesapeake Bay: How is it Doing???
Habitat Conversion
Water Quality Problems Algae blooms and depleted oxygen levels are caused by excessive nutrients When the algae die and decompose, they use up oxygen needed by other plants and animals living in the Bay's waters. Poor water clarity is caused by algae blooms and suspended sediments Algae blooms and sediment cloud the water and block sunlight, causing underwater bay grasses to die.
Nutrient and/or Sediment Impaired Impaired WatersEPA 303(d) list Portions of the Chesapeake Bay and its tidal rivers are listed under the Clean Water Act as “impaired waters” largely because of low dissolved oxygen levels and other problems related to nutrient pollution. This “listing” requires the development of a clean-up plan for the Bay by 2011. Note: Representation of 303(d) listed waters for nutrient and/or sediment water quality impairments for illustrative purposes only. For exact 303(d) listings contact EPA (http://www.epa.gov/owow/tmdl/). Impaired Water Unimpaired Water
Healthy vs. Unhealthy Water Quality Sunlight Minimal nutrient and sediment inputs Sunlight Excessive nutrient and sediment inputs Algal Bloom Balanced Algae Growth Healthy Bay Grasses Reduced Bay Grasses Healthy Habitat Unhealthy Habitat Algae Die-off Algae Decomposition Healthy Oyster Reef Barren Oyster Reef Adequate Oxygen No Oxygen No Benthic Community Benthic Community
Nonpt. Sources • Run-off from farmland • Run-off from lawns and paved areas Point Sources • Industry • Wastewater Treatment Plants Sources of Pollutants to the Bay
Nature of Contaminant Inputs Nonpoint Source Origin of discharge is diffuse Discharge may be transient in time Runoff from cropland Effluent from septic systems Highway de-icing salts Point Source Inputs with well defined point of discharge Discharge is usually continuous Leakage from landfills and storage tanks Wastewater treatment facilities Industrial inputs
Non-pointSource Pollutants Toxic Substances Sediment Pathogens Nutrients
2010 Nitrogen Goal 2010 Phosphorus Goal 2010 Sediment Goal Nutrient and Sediment Load Reduction Goals The 2010 pollutant reduction goals are: Nitrogen - Reduce annual loads to no more than 175 million pounds. Phosphorus - Reduce annual loads to no more than 12.8 million pounds. Land-based Sediment - Reduce annual loads to no more than 4.15 million tons.
Rockfish Population Stable Baywide Female Spawning Stock Biomass Rockfish have rebounded to levels not seen since the 1950’s, but concerns remain over disease, sufficient sources of food and availability of spawning habitat. Fishing moratoria: MD & DE: 1985-1990 VA: 1989-1990
Oysters at Historic Lows Oyster populations in the Chesapeake are at historic lows due to disease, intense harvest pressure and poor water quality.
Blue Crabs At Risk Mature Female Blue Crabs Blue Crab populations have stabilized at below-average levels. Improved water quality and habitat restoration efforts along with proper management of the crab harvest are needed to restore the Bay’s blue crab populations. Average
Blue Crab Largest crab fishery in the world $80 million dockside value in Ches Bay $360 million value to national economy
Bay Grasses Show Annual Variation Restoration Goal (185,000 acres by 2010) Underwater bay grasses are slowly improving, but further reductions in the pollutants flowing into the Bay are needed to help them flourish. Annual variations in bay grasses show the sensitivity of the Bay ecosystem. *Note – Hatched area of bar includes estimated additional acreage. No Baywide surveys 1979-83 and 1988 Source: Chesapeake Bay Program.
PRE-1930’S 1960’S PRESENT
Special thanks to: Dr. Bob Orth, VIMS SAV Program Chesapeake Bay Program Chesapeake Bay Foundation NOAA Chesapeake Bay Office