Download
1 / 29
300 likes | 327 Vues
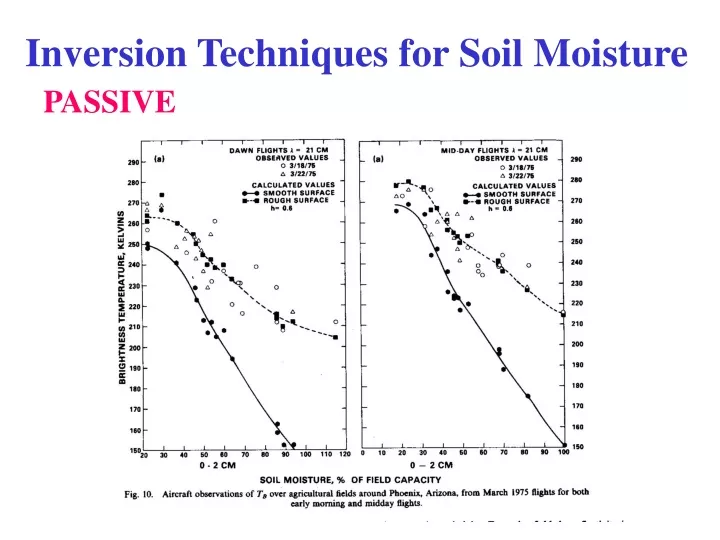
Inversion Techniques for Soil Moisture. PASSIVE. SM v = a 1 +a 2 .e+a 3 .e 2 +a 4 .e 3 +a 5 .e 4. Surface Roughness. X-band C-band L-

E N D
Surface Roughness X-band C-band L- 0.05 smooth smooth smooth 0.5 rough interm. smooth 1.5 rough rough interm. 10.0 rough rough rough
Vegetation Covered Soil b is a constant and depends on crop type and frequency W – Vegetation water content g/m2
Soil Moisture Estimation using Passive Microwave Data Tbi – Observed Brightness Temperature at 6.6, 10.7 and 18 GHz (HH, VV polarizations) i – Calculated TB values - Measurement noise Standard deviation for each channel
Soil Moisture Estimation using Passive Microwave Data Tbi – Observed Brightness Temperature at 6.6, 10.7 and 18 GHz (HH, VV polarizations) i – Calculated TB values - Measurement noise Standard deviation for each channel me – soil moisture, We vegetation water content, Te-temperature, qv- atmosphere water vapor
Soil Moisture Estimation using Active Microwave Data ACTIVE IEM Model (ERS-2 SAR Data, Cvv )
Empirical Retrieval Model (ENVISAT) C-hh and C-vv • = Real part of Dielectric Constant h = r.m.s. surface height
April 14, 1994 Oct. 5, 1994 Soil Roughness Soil Moisture Soil Roughness Soil Moisture
Oh et al. Semi-empirical Model (1992) Needs fully polarimetric Data (HH, VV and HV) for taking ratios Valid L to X-band with incidence angle range 10 to 700. Where 0 Fresnel reflectivity at 00incidence angle These equations are inverted for the calculation of dielectric constant ’and ks (surface roughness) The relation between dielectric constant and volumetric soil moisture (Topp et al. 1980)
Soil Moisture Map, Oh et al. Pauli RGB, West Bengal 20% 0 March 7, 2007 April 22, 2007
Pauli RGB, Haryana Test Site Soil Moisture Map, Oh et al. Nov. 19, 2006 Jhajjar Rewari 12% 0
Rajasthan, Sawai Madhopur district Soil Moisture Map May 28, 2007 20% 0
Punjab, Patiala and surroundings, Soil Moisture Map Nov. 19, 2006 20% 0
Agriculture Applications • Vegetation Parameters • Plant Height, Cover, Density • Lear Area Index • Plant Biomass/Water Content • Plant Row Direction • Growth Stage • Canopy Structure • Soil Parameters • Soil Moisture • Soil Roughness • Tillage Direction
Single Date classification accuracy = 55% Multi-date (4 scenes) temporal data = 90%