Download
1 / 19
190 likes | 199 Vues
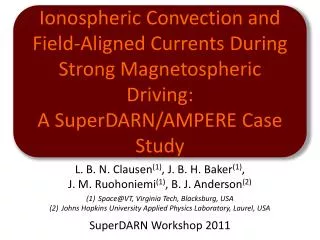
Making sense of SuperDARN elevation: Ionospheric diagnostics. Pasha Ponomarenko , Jan Wiid, Sasha Koustov, and Jean-Pierre St.-Maurice University of Saskatchewan, CANADA. SuperDARN Workshop, 29 May - 3 June 2011, Hanover, USA. Abstract.

E N D
Making sense of SuperDARN elevation: Ionospheric diagnostics Pasha Ponomarenko, Jan Wiid, Sasha Koustov, and Jean-Pierre St.-Maurice University of Saskatchewan, CANADA SuperDARN Workshop, 29 May - 3 June 2011, Hanover, USA SuperDARN Workshop, 29 May - 3 June 2011, Hanover, USA
Abstract The elevation angle of HF signals contains information about ionospheric conditions affecting radio wave propagation. Unfortunately, this parameter has rarely been utilised in SuperDARN experiments due to the apparent bias attributed to some unaccounted-for phase offset. However, in the accompanying presentation we demonstrated that this effect, in fact, reflects the statistical variability of the phase measurements, and the majority of the elevation data can be trusted. Ray tracing modelling of the HF backscatter characteristics reveals the presence of two possible propagation modes related to Pedersen and low-angle rays. The first mode is characterised by very little variation in elevation with range and contains information about the refractive index (i.e. electron density) in the vicinity of the ionospheric maximum. Careful analysis of elevation data from the Rankin Inlet PolarDARN radar has shown that the Pederesen regime is regularly observed in daytime hours during the spring-summer-autumn months. Applying Snell’s law for the spherical geometry and the simplest form of the Appleton-Hartree equation to these data, we have attempted to reconstruct seasonal-diurnal variations of the maximum electron density near 70LAT. SuperDARN Workshop, 29 May - 3 June 2011, Hanover, USA
Outline Previous work Model calculations Experimental tests Conclusions and future work SuperDARN Workshop, 29 May - 3 June 2011, Hanover, USA
Previous work • André et al, 1997: E-layer height and critical frequency from ground scatter elevation • Milan et al, 1997: identification of signals coming “from behind“ • Chisham, Yeoman & Sofko, 2008: improving range-finding algorithm SuperDARN Workshop, 29 May - 3 June 2011, Hanover, USA
General idea ns n0 0 IB ≈ 90° Snell’s Law: SuperDARN Workshop, 29 May - 3 June 2011, Hanover, USA
IB More diligent treatment by Rob Gilles • Snell’s Law in spherical geometry: n Rcos = const • Aspect conditions: k ·B = 0 SuperDARN Workshop, 29 May - 3 June 2011, Hanover, USA
Aspect contour – two branches B0 k B0 Pedersen 400 800 1000 Low-angle SuperDARN Workshop, 29 May - 3 June 2011, Hanover, USA
Elevation in Pedersen and low-angle rays SuperDARN Workshop, 29 May - 3 June 2011, Hanover, USA
Rankin Inlet: dominance of ionospheric scatter Good place to look at! SuperDARN Workshop, 29 May - 3 June 2011, Hanover, USA
What happens in reality? Day, summer Night, winter SuperDARN Workshop, 29 May - 3 June 2011, Hanover, USA
Elevation gradient SuperDARN Workshop, 29 May - 3 June 2011, Hanover, USA
General selection criteria • Ionospheric scatter only (FITACF criteria) • SNR ≥ 6 dB • Virtual height ≥ 200 km (no E region) • Elevation < 36 deg (no phase “flipping”) SuperDARN Workshop, 29 May - 3 June 2011, Hanover, USA
Searching for Pedersen mode • Fitting linear function to elevation vs range dependence across range gates 15-30 (½-hop F-region, no E-region) • Selection criteria for Pedersen mode: • At least 5 valid elevation values • Fitted Slope ≤ 2*(fitting error) • Slope fitting error ≤ 0.5 deg/gate • If the above selection criteria are satisfied then calculate median elevation angle SuperDARN Workshop, 29 May - 3 June 2011, Hanover, USA
Monthly statistics SuperDARN Workshop, 29 May - 3 June 2011, Hanover, USA
Critical frequencies and Nemax SuperDARN Workshop, 29 May - 3 June 2011, Hanover, USA
Diurnal variations SuperDARN Workshop, 29 May - 3 June 2011, Hanover, USA
Relation to 10.7 cm emission flux SuperDARN Workshop, 29 May - 3 June 2011, Hanover, USA
Conclusions • Elevation can be used to estimate critical frequencies/maximum electron densities of the F-layer. • Annual-diurnal variations show behave reasonably • Measured frequency range is limited by spherical geometry and interferometer base length SuperDARN Workshop, 29 May - 3 June 2011, Hanover, USA
Future work • Diagnostic capabilities of both Pedersen and low-angle modes in ionospheric and ground scatter (e.g. Andre et al 1998). • Detailed analysis and interpretation of nighttime ionograms and respective elevation profiles SuperDARN Workshop, 29 May - 3 June 2011, Hangover, USA