Download
1 / 41
440 likes | 621 Vues
GIS Applications in Watershed Analysis …..the watershed unit. Dr. Dennis L. Johnson Assistant Professor Michigan Technological University COMET Hydrometeorology 99-2 Friday, 25 June 1999. Today’s Purpose. Introduce the Concepts of a GIS Applications of a GIS Focus on the Watershed Unit

E N D
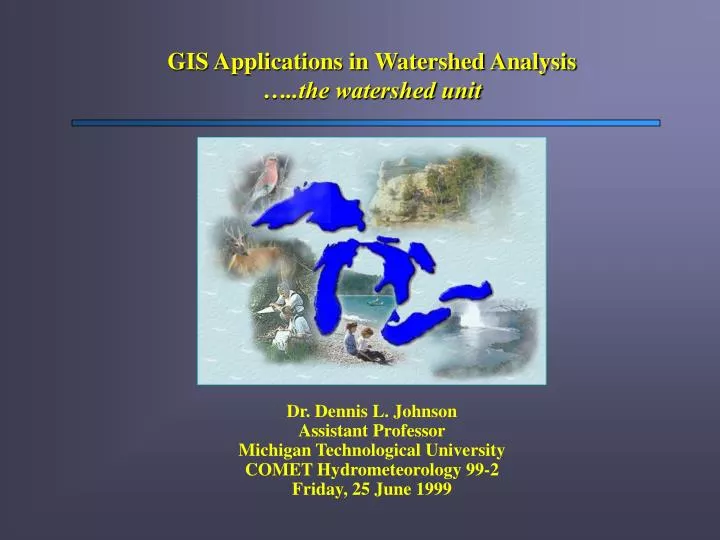
GIS Applications in Watershed Analysis…..the watershed unit Dr. Dennis L. Johnson Assistant Professor Michigan Technological University COMET Hydrometeorology 99-2 Friday, 25 June 1999
Today’s Purpose • Introduce the Concepts of a GIS • Applications of a GIS • Focus on the Watershed Unit • …. Get you thinking …... DLJ 99 - Juniata College
What is a GIS ? • A GIS is a Geographical Information System • A series of data layers (maps) that represent some feature on the earth’s surface • Ability to “overlay” !! • All data is “georegistered” DLJ 99 - Juniata College
Georegistered ? • Representing a curved surface in a flat plane • Locating that plane on the earth • 3 issues • sphere • datum • projection DLJ 99 - Juniata College
Sphere & Datum Mathematically describe a sphere Lock it down by making it touch the earth somewhere NAD27- Kansas Use satellites in modern day NAD83 DLJ 99 - Juniata College
Project to a Flat Surface Touches at the equator Touches at 2 lines of latitude DLJ 99 - Juniata College
Unwrap the Cylinder One cylinder for each data layer Represent the data electronically A GIS!!! DLJ 99 - Juniata College
GIS Layers Elevations Discharge Points Rivers DLJ 99 - Juniata College
A DEM • A Digital Elevation Model or DEM is used to represent the elevations of a section or area of land. • The DEM is generally a gridded or raster data set. • A raster data set means a series of rows and columns with each grid cell representing a property such as elevation. DLJ 99 - Juniata College
Create A DEM from a Topographic Map DLJ 99 - Juniata College
A Bunch of Blocks to Represent the Earth DLJ 99 - Juniata College
A DEMWhat the Computer Sees & What You See DLJ 99 - Juniata College
Other Views DLJ 99 - Juniata College
Assign Flow Directions DLJ 99 - Juniata College
Our Simple Area DLJ 99 - Juniata College
Each Cell Flows Into Another • Note that each grid cell flows into another grid cell and so forth. • One could tally or keep track of the total number of grid cells that flow into each “downstream” grid cell. • This is generally known as a flow accumulation data set. DLJ 99 - Juniata College
Our Flow Accumulation DLJ 99 - Juniata College
Let’s Look at an Example DLJ 99 - Juniata College
Add Rivers Juniata College DLJ 99 - Juniata College
Zoom In DLJ 99 - Juniata College
Assign Flow Directions DLJ 99 - Juniata College
Calculate Flow Accumulations DLJ 99 - Juniata College
Overlay Streams DLJ 99 - Juniata College
Let’s Delineate a Watershed Just Below Raystown Lake (dam) DLJ 99 - Juniata College
Delineate Raystown Lake DLJ 99 - Juniata College
Another View DLJ 99 - Juniata College
Isolate Raystown Lake DLJ 99 - Juniata College
Flow Directions in Raystown Watershed DLJ 99 - Juniata College
South Facing Slopes DLJ 99 - Juniata College
Buffer the Streams ~100m DLJ 99 - Juniata College
Find South Faces < 100m from Stream DLJ 99 - Juniata College
DEM DLJ 99 - Juniata College
Flow Direction DLJ 99 - Juniata College
Slope DLJ 99 - Juniata College
Stream Delineation DLJ 99 - Juniata College
K Values K = 1.2 K = 0.48 K = 2.1 DLJ 99 - Juniata College
Velocity V = KS1/2 DLJ 99 - Juniata College
Flow Length DLJ 99 - Juniata College
Advantages of GIS • Time Savings • Replication -Precision not Accuracy!!! • Ancillary Data • Data Reuses DLJ 99 - Juniata College
Lake Superior SWE • U.S. Army Corps of Engineers • Manage Lake Superior • Sault Ste. Marie Locks • Snowfall is major contributor DLJ 99 - Juniata College