Download
1 / 18
190 likes | 361 Vues
Investigating Oblique and Non-Linear Asymptotes and the Graphs of Rational Functions. Reference Chart for Review of Vertical and Horizontal Asymptotes. Rational Numbers a) Given , use long division to find the quotient q and remainder r

E N D
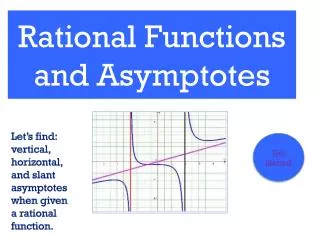
Investigating Oblique and Non-Linear Asymptotes and the Graphs of Rational Functions
Reference Chart for Review of Vertical and Horizontal Asymptotes
Rational Numbers a) Given , use long division to find the quotient q and remainder r and write it in the form of b) How can we verify that this result is correct? In other words, how do we verify the answer to ANY division problem? Connection to Prior Learning
Investigation: Rational Functions without Horizontal Asymptotes • Let’s investigate a rational function where the degree of the numerator is one greater than the degree of the denominator. For example: • Use either long division or synthetic division to determine the quotient and remainder. (Hint: The remainder should be 45. If you don’t get 45, raise your hand.) • Quotient = Q(x)= • Remainder = R(x) = 45 • Numerator of rational function = N(x) = • Denominator of rational function = D(x) =
Alternate Form of Rational Functions • Any rational function of the form can written as where Q(x) and R(x) are the quotient polynomial and the remainder polynomial, respectively, when we divide N(x) by D(x). Rewrite in the form
Comparing a Rational Function & Its Quotient • Y1 = • Y2 = • Next, set up your table by accessing [TBLSET] and set the “Indpnt” variable to “Ask” so that you can input your x values into the table. Finally, select [TABLE] and enter the xvalues from the tables, recording the corresponding y values.
Comparing a Rational Function & Its Quotient Cont’d • What can you say about the values in Y1 relative to the values in Y2 as x+∞? As x+∞, the values of Y1 approach the values of Y2
Comparing a Rational Function & Its Quotient Cont’d • Using the window settings shown, graph and sketch: Y1 = using one color, and Y2 = using a different color x:[-25,25] scale:5 y:[-150,50] scale:25 • Where do the graphs of the rational function and the quotient function look alike? Where do they look different?
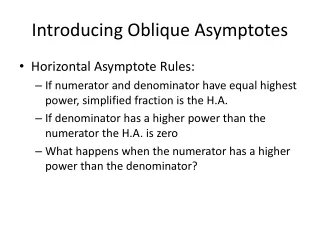
Comparing a Rational Function & Its Quotient, Cont’d • Notice that as x+∞, the graph of approaches the line • The line is what we call an oblique asymptote. An oblique asymptote is a non-horizontal line which the graph of the rational function approaches as x+∞. • Knowing that can be expressed as , why does the graph of approach the graph of as x+∞? (Hint: Think about what happens to as x+∞ .)
gets closer and closer to zero as x approaches +∞ so the graphs of and get closer and closer. • You’ve explained why the graphs are close to each other as x approaches +∞ . Give one possible reason why the graphs are not close to each other near x = -3? When x is near -3, the value of is relatively large, so not close to zero. Therefore, the graphs will not be close to each other. For example, substitute x = -2 into the rational function and the quotient function.
Investigation: Numerator degree = 2 + Denominator degree • Now let’s investigate a rational function where the degree of the numerator is two greater than the degree of the denominator. Example: • Use long division or synthetic division to determine the quotient and the remainder. Then write the function in the form of • Q(x)= • R(x) = 22 • y = = • How does your quotient differ from the quotient in the first problem?
Investigation: Numerator degree = 2 + Denominator degree • Once again, let’s compare the functions by table values • Y1 = • Y2 = • What can you say about the values of the rational function relative to the values of the quotient polynomial function as x+∞?
Investigation: Numerator degree = 2 + Denominator degree • Using the window settings shown, graph and sketch: Y1 = using one color, and Y2 = using a different color x:[-10,10] scale:1 y:[-40,100] scale:20 • Explain why the graph of must approach the graph of as x+∞. (Hint: Think about what happens to as x+∞ .)
Investigation: Numerator degree = ? + Denominator degree • Given the rational function , answer the following: The degree of the numerator is how much greater than the degree of the denominator? • Q(x)= • R(x) = • y = = 3
Investigation: Numerator degree = 3 + Denominator degree • Using the window settings shown, graph and sketch: Y1 = using one color, and Y2 = using a different color x:[-8,8] scale:1 y:[-500,500] scale:100 • What do the graphs suggest to you about the rational function and its corresponding quotient function? Explain.
Investigation: Numerator degree = ? + Denominator degree • Given (Note that the division has already been done for you!) Use the information above to determine the asymptote of the graph of when x+∞ • Verify your answer by graphing the rational function and your asymptote. x:[-6,6] scale:1 y:[-200,400] scale:50
Independent Practice • Find the equation of the asymptote for each of the following rational functions: a) b) c)