Download
1 / 38
420 likes | 559 Vues
Food Recognition Using Statistics of Pairwise Local Features. Shulin (Lynn) Yang University of Washington Mei Chen Intel Labs Pittsburgh Dean Pomerleau Robotics Institute Rahul Sukthankar Carnegie Mellon. Abstract.

E N D
Food Recognition Using Statistics of Pairwise Local Features Shulin (Lynn) Yang University of Washington Mei Chen Intel Labs Pittsburgh Dean PomerleauRobotics Institute Rahul SukthankarCarnegie Mellon
Abstract Food items are deformable objects that exhibit significant variations in appearance Food recognition is difficult the key to recognizing food is to exploit the spatial relationships between different ingredients (such as meat and bread in a sandwich).
Introduction • The goals of such systems are to enable people to better understand the nutritional content of their dietary choices and to provide medical professionals with objective measures of their patients’ food intake .
Pairwise local feature distribution (PFD) • 1. Soft labeling of pixels • 2. Global Ingredient Representation (GIR) • 3. Pairwise Features • 4. Histogram representation for pairwise feature distribution • 5. Histogram normalization • 6. Classification with local feature distributions
Pairwise local feature distribution (PFD) • 1. Soft labeling of pixels • 2. Global Ingredient Representation (GIR) • 3. Pairwise Features • 4. Histogram representation for pairwise feature distribution • 5. Histogram normalization • 6. Classification with local feature distributions
Pairwise local feature distribution (PFD) • 1. Soft labeling of pixels • 2. Global Ingredient Representation (GIR) • 3. Pairwise Features • 4. Histogram representation for pairwise feature distribution • 5. Histogram normalization • 6. Classification with local feature distributions
Pairwise Features • Sturges’ formula: • Use the log of the distance between the pair of pixels P1 and P2: • Pairwise orientation, O(P1; P2), is defined as the angleof the line connecting the pixel pair. It ranges in [; ], and positive is counter clockwise
Between-pair category • Between-pair category : B(P1,P2) • The feature for each pixel pair has t discrete values, t being the number of pixels exist along the line between a pair of pixels. We use to represent the feature set for pixels P1 and P2.
Pairwise local feature distribution (PFD) • 1. Soft labeling of pixels • 2. Global Ingredient Representation (GIR) • 3.Pairwise Features • 4. Histogram representation for pairwise feature distribution • 5. Histogram normalization • 6. Classification with local feature distributions
Histogram representation for pairwise feature distribution • For an image with M pixels, we would need to consider pairs. • use a set P to represent the N pixels we randomly pick from an image: • The soft labels of the N pixels are represented as
Pairwise local feature distribution (PFD) • 1. Soft labeling of pixels • 2. Global Ingredient Representation (GIR) • 3. Pairwise Features • 4. Histogram representation for pairwise feature distribution • 5. Histogram normalization • 6. Classification with local feature distributions
Experimental Methodology • 1. Dataset • 2. Baseline approaches • 3. Preprocessing with STF
Experimental Methodology • 1. Dataset • 2. Baseline approaches • 3. Preprocessing with STF
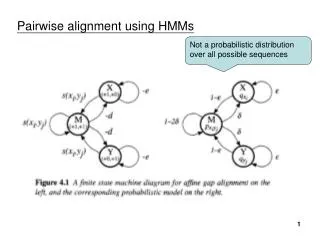
SVM 理論 • 實線為找出的Hyper-plan,將H1 與H2 稱之為Support Hyper-plans,而我們希望能夠找出最佳的Classification Hyper-plan 使兩Support Hyper-plans 之間有最大的Margin。
Experimental Methodology • 1. Dataset • 2. Baseline approaches • 3. Preprocessing with STF
Results • 1. Classification accuracy on the 61 categories
Confusion matrixRows: the 61 categories of foodColumns: the ground truth categories
Even for humans,to distinguish.So61 PFID food categories 7major groups
2. Classification accuracy into 7 major food types • 1.sandwiches • 2.salads/sides • 3.chicken • 4.breads/pastries • 5.donuts • 6.bagels • 7.tacos
Confusion matrixRows: the major 7 food categories Columns: the ground truth major categories
Result • (OM) Orientation and midpoint is the higher-order feature that gives the best accuracy. • This pair of features is able to leverage the vertically-layered structure of many fast foods.
In future work We plan to extend our method to: • (1) Perform food detection and spatial localization in addition to whole-image recognition • (2) Handle cluttered images containing several foods and non-food items • (3) Develop practical food recognition applications • (4) Explore how the proposed method generalizes to other recognition domains