Download
1 / 9
90 likes | 188 Vues
The Structure of a Hypothesis Test. Hypothesis Testing. Hypothesis Test Statistic P-value Conclusion. Fair Coin?. How do we determine if a coin is fair?

E N D
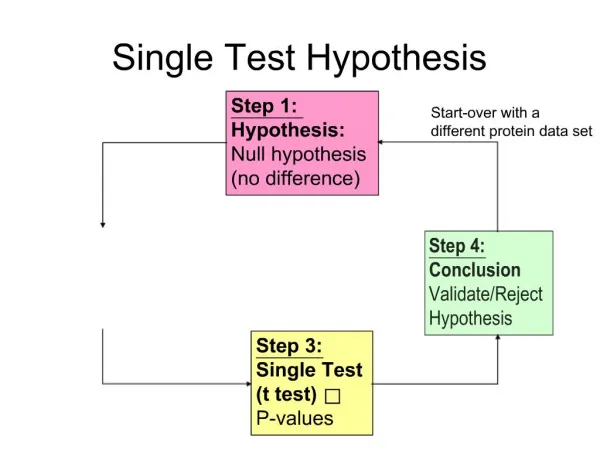
Hypothesis Testing • Hypothesis • Test Statistic • P-value • Conclusion
Fair Coin? • How do we determine if a coin is fair? • Suppose you flipped it 100 times and you obtained 52 heads and 48 tails. You would most likely be OK with that. What if we obtained 10 heads and 90 tails. You would probably consider the coin biased. • So if we assume the coin is fair (50 heads/50 tails), how likely is it that we observed our result (of 10 heads and 90 tails; or 52 heads and 48 tails)
Null Hypothesis • Denoted H0; • The “status quo” hypothesis. • In the coin-flipping problem, our null hypothesis would be: H0: the coin is fair • This could also be written more mathematically as: H0: p = 0.5, where p is the probability of obtaining a head (or a tail)
Alternative • Once we set up the null hypothesis, we state the alternative hypothesis • Denoted HA or H1 • For our coin flipping example: HA: the coin is not fair Or, mathematically HA: p ≠ 0.5 (the probabilityof heads (or tails) is not 0.5).
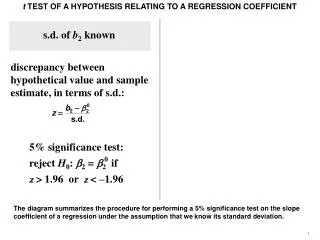
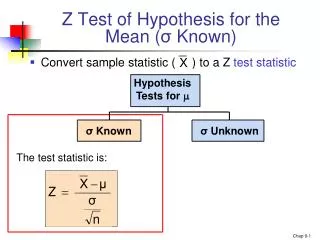
Perform the experiment • Suppose we obtained 55 heads in our experiment. • We will perform the 1-PropZ test (using the TI-83/84):
Test Statistic & P-Value • The test statistic is z = 1 with a p-value of about 0.32. • Note that the p-value is a different number than the p in the null hypothesis. Do not get these confused.
Conclusion • A p-value of 0.32 is rather high. • We compare the p-value to a predetermined alpha value, usuallyα = .05. • So we fail to reject the null hypothesis that the coin is fair (or p = 0.5). • There is not enough evidence to conclude that the coin is biased (that is, the proportion of heads is not different from 0.5).
Check • Suppose we are testing the same question – is the coin fair? – and we obtained 65 heads in our experiment, instead of 55. • Perform the 1-PropZ test. What p-value did you get? • Should you conclude that the coin is most likely fair?