Download
1 / 19
190 likes | 298 Vues
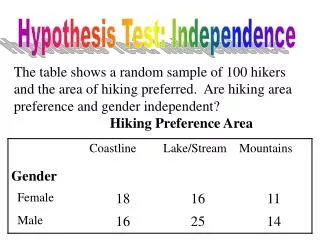
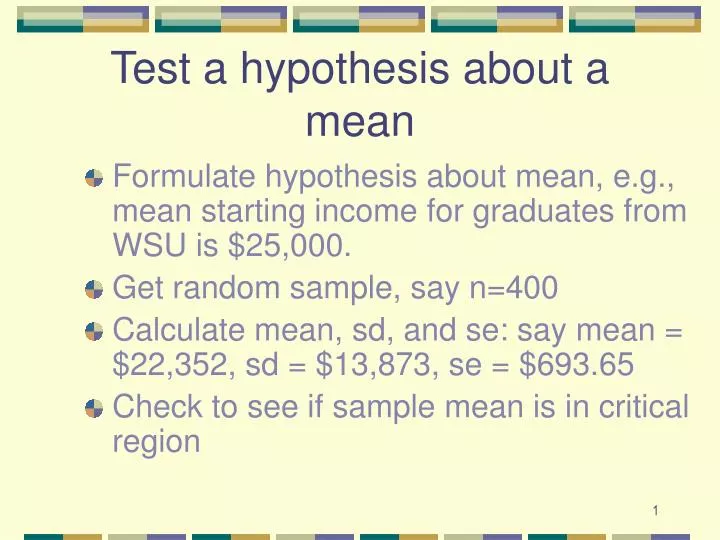
Test a hypothesis about a mean. Formulate hypothesis about mean, e.g., mean starting income for graduates from WSU is $25,000. Get random sample, say n=400 Calculate mean, sd, and se: say mean = $22,352, sd = $13,873, se = $693.65 Check to see if sample mean is in critical region.

E N D
Test a hypothesis about a mean • Formulate hypothesis about mean, e.g., mean starting income for graduates from WSU is $25,000. • Get random sample, say n=400 • Calculate mean, sd, and se: say mean =$22,352, sd = $13,873, se = $693.65 • Check to see if sample mean is in critical region
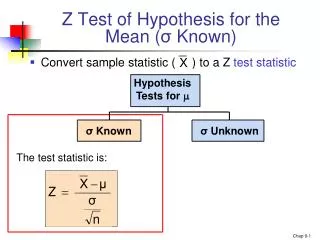
Quick review Mean Standard Deviation Standard Error of the Mean
Test hypothesis mean is $25,000 Mean: $23,352 sd: $13,873 n=400 se: $693.65 Critical Region $25,000 Sample Mean $25,000 + 2* $693.65 = $26,387 $25,000 - 2* $693.65 = $23,613 REJECT HYPOTHESIS
Create a 95% confidence interval • We want to know what is the mean starting income for graduates from WSU. • Get random sample, say n=400 • Calculate mean, standard deviation:say mean = $23,352, sd = $13,873 • Calculate the standard error:$13,873 / 20 = $693.65
Create 95% confidence interval • Use formula: • Low end = $23,352-2*$693.65=$21,964 • High end= $23,352+2*$693.65=$24,739 • Interval is: $21,964 - $24,739 note this does not include $25,000
Always a mean? • Proportions are a form of mean, but if the population proportion is known or estimated, its variance is given. Where X is either 0 or 1 Mean sd se
Always a mean? • Sometime we wish to test a difference between two means. • We consider paired data now and independent samples later. • Paired data would exist if we sampled pairs of cases, e.g., husband and wife.
Paired difference of means • Calculate difference for each pair, for example age of husband and age of wife. • This difference is a new variable Mean sd Standard error
Hypothesis of no difference • For paired data, this amounts to a hypothesis that d-bar is zero. Minus 2 standard errors Plus 2 standard errors 0
Some examples (husband - wife) Var | Mean Std. Err. t P>|t| age | 1.677316 .2001067 8.38211 0.0000 income | 6.193548 .8836383 7.00914 0.0000 love | 2.852716 .6497145 4.39072 0.0000 depress | -2.055539 .7851498 -2.61802 0.0093 esteem | .659164 .3386991 1.94616 0.0525 efficacy | -.4057508 .2331804 -1.74007 0.0828 What decisions do we make in each case?
Decisions • Reject hypothesis • Correctly --- ??? Powerof the test • Error --- 5% Type I or alphaerror • Fail to reject hypothesis • Correctly --- 95% • Error --- Type II or beta error
One more test • Sign test for median • A nonparametric test -- not based on a measurement • Like a one sample t test for the mean • Especially good for small samples • Based on binomial distribution
Sign test for median • Hypothesize a particular median value • Count number of observations above and below the hypothesized value • If hypothesis is true, there should be approximately equal numbers of observations above and below • Probability of being above is .5 if the hypothesis is true
Consider • Hypothesize median age: 23 • Obs: 24 25 2723 23 22 18 35 19 26 20 28 24 26 21 (14 cases) • Count: • above: 8 • below: 4 • at: 2
Find binomial probability • Find the probability of getting a split of 8 to 4 (ignore the two cases at the hypothesized median) • Use the binomial • Find p(8) or p(9) or p(10) or p(11) or p(12), assuming p of being above median is .5
Calculate .1208 .0537 .1937 .0161 Fail to reject hypot. .0029 .0002
Large samples • What happens when sample size increases? Consider sample sizes of 4, 25, 100, 400. Assume: s = 5 se = 2.5, 1, .5, .25 for n = 4 25 100 400
How big a sample do we need? • To show a 1 year difference in ages is significant at .05 level for husbands and wives. • Assume sd of age is 5 years • Want se of .5 so that 2 se is 1 years
Sample size? Difference in years -1 0 1 .5 = 5 / sqrt(n) Square both sides n = 100 .25 = 25 / n