Download
1 / 34
340 likes | 478 Vues
COSOSIMO. Estimating System-of-System Architecture Definition and Integration Effort. Jo Ann Lane University of Southern California Center for Software Engineering. Goals of This Presentation. Provide an overview of System-of-system concepts

E N D
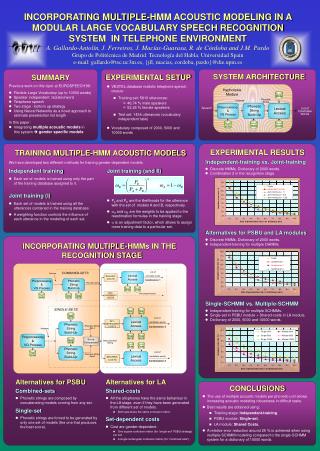
COSOSIMO Estimating System-of-System Architecture Definition and Integration Effort Jo Ann Lane University of Southern California Center for Software Engineering
Goals of This Presentation • Provide an overview of • System-of-system concepts • The desired system-of-system activities to be covered by the cost model • The cost model approaches, concepts, and definitions • Current issues/questions under investigation • Present an example using current investigational version of cost model • Solicit data for further model investigations and calibration • Obtain feedback/suggestions on approach and data collection
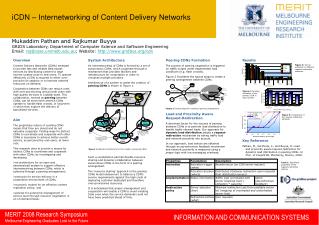
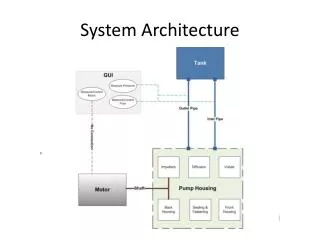
SOS …… S1 S2 Sm S11 S12 S1n S21 S22 S2n Sm1 Sm2 Smn …… …… …… System of Systems (SoS) Concept
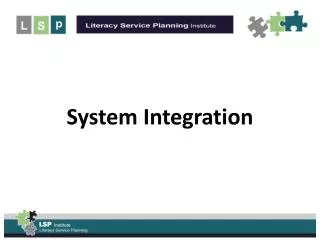
Legend COCOMO COSYSMO COSOSIMO High Level Partitioning of Cost Models COSOSIMO SOS System of System Architecting Integration/Test System System Integration/Test COSYSMO Architecting Software Requirements Analysis Software Acceptance Test COCOMO II Preliminary Design Integration Detailed Design Unit Test Coding
Constructive System-of-System Integration Cost Model (COSOSIMO) • Parametric model to estimate the effort associated with the definition and integration of software-intensive “system of systems” components • Includes at least one size driver and 6 exponential scale factors related to effort • Targets input parameters that can be determined in early phases • Goal is to have zero overlap with COCOMO II and COSYSMO
COCOMO II Application and system software development Elaboration Construction Development of test tools and simulators (estimated as a separate set of software) Resolution of software errors detected during test activities COSYSMO System/sub-system definition Operational concepts Operational scenarios System/sub-system elaboration System integration and test Resolution of system-level errors detected during test activities Deployment Maintenance Key Activities Covered by Each Cost Model • COSOSIMO • SoS architecture definition • SoS integration activities • Development of SoS integration lab • Development of SoS level test plans and procedures • Execution of test SoS test procedures • High-level isolation of problems detected during integration
COCOMO II Software development Development phases 20+ years old 161 calibration points 23 drivers Size is driven by effective SLOC (eSLOC) COSOSIMO System of Systems architecture definition and integration Pre and Post COCOMO II effort Very new Only expert validation 6 exponential scale factors Candidate drivers Effective KSLOC (eKSLOC) Logical interfaces at SoS level Model Differences • COSYSMO • Systems engineering • Entire life cycle • 3 years old • 11 calibration points • 18 drivers • Size is driven by • requirements • interfaces • algorithms • operational scenarios
COSOSIMO Operational Concept Size Drivers • Interface-related eKSLOC • Number of logical interfaces at SoS level COSOSIMO SoS Definition and Integration Effort Exponential Scale Factors • Integration simplicity • Integration risk resolution • Integration stability • Component readiness • Integration capability • Integration processes Calibration
ni Bi Level 1 IPM (Si) = AiSize (Sij) j=1 mi B0 Level 0 IPM (SoS) = A0 IPM (Si) i=1 COSOSIMO Model Equations • Two level model that • First determines integration effort • for first level subsystems…. • Then, using subsystem integration • effort and SoS characteristics, • determines SoS integration effort… Level 0 SOS Level 1 S1 S2 …… Sm S11 S12 S1n S21 S22 S2n Sm1 Sm2 Smn …… …… ……
COSOSIMO Model Parameters IPM Integration effort in Person Months Si The ith subsystem within the SoS A Constant derived from historical project data Size Determined by computing the weighted average of the size driver(s) ni Number of Subsystem level 2 components comprising the ith subsystem m Number of Subsystem level 1 components comprising the SoS Bi Effort exponent for the ith subsystem based on the subsystem’s 6 exponential scale factors. The sum of the scale factors results in an overall exponential effort adjustment factor to the nominal effort. B0 Effort exponent for the SoS based on the SOS’ 6 exponential scale factors. The sum of the scale factors results in an overall exponential effort adjustment factor to the nominal effort.
Current Level 1 Size Driver • Subsystem development size measured in effective KSLOC (eKSLOC) • eKSLOC can be calculated using COCOMO II • Size weighted by • Complexity • Volatility • Degree of COTS/reuse S1 S2 S3 S4
S2 S1 S4 S3 Additional Proposed Size Drivers • Number of major interfaces • Number of operational scenarios • Each weighted by • Complexity • Volatility • Degree of COTS/reuse
Subsystem Software Size This driver represents the software subsystem size. It is measured in terms of effective thousand lines of code (eKSLOC). eKSLOC can calculated using COCOMO II or a comparable estimation model or technique.
Number of Major Interfaces This driver represents the number of shared major physical and logical boundaries between subsystem components or functions (internal interfaces) and those external to the subsystem (external interfaces). These interfaces typically can be quantified by counting the number of interfaces identified in either the subsystem’s context diagram and/or by counting the significant interfaces in all applicable Interface Control Documents.
Number of Operational Scenarios This driver represents the number of operational scenarios that a system must satisfy. Such threads typically result in end-to-end test scenarios that are developed to validate the system and satisfy all of its requirements. The number of scenarios can typically be quantified by counting the number of unique end-to-end tests used to validate the system functionality and performance or by counting the number of high-level use cases developed as part of the operational architecture.
Integration Simplicity (ISMPL) Represents a parameter which includes system component coupling, processing criticality, scope of key performance parameters, and system precedentedness.
Integration Risk Resolution (IRESL) Represents a multi-attribute parameter which includes number of integration risk items, risk management/mitigation plan, compatible schedules and budgets, expert availability, tool support, level of uncertainty in integration risk areas. IRESL is the subjective weighted average of the listed characteristics.
Integration Stability (ISBLY) Indicates anticipated change in integration components during system of system integration activities.
Component Readiness (CREDY) Indicates readiness of component (sub-component) for integration. Includes level of verification and validation (V&V) that has been performed prior to integration and level of subsystem integration activities that have been performed prior to integration into the SOSIL.
Integration Capability (ICAPY) Represents a multi-attribute parameter which includes the integration team cooperation and cohesion, integration personnel capability and continuity, and integration personnel experience (application, language, tool, and platform). ICAPY is the subjective weighted average of the listed characteristics.
Integration Processes (IPROC) Represents a parameter that rates the maturity level and completeness of an integration team’s integration processes, plans, and the SOS integration lab (SOSIL). IPROC is the subjective weighted average of the listed characteristics.
Issues and Questions Currently Under Investigation • What is the best size driver • If software size used • Should it be limited to the software performing interface operations • How should COTS product interfaces be accounted for • If number of logical interfaces is used • Which ones to include • What level to count • How to specify complexities associated with various interfaces • Do user scenarios and user interfaces capture additional size information needed to better estimate level of effort • If multiple size drivers used, what is the relative weight of each • Model outputs • Desired granularity of effort estimates • Associated schedule?
Issues and Questions Currently Under Investigation (continued) • How to ensure no overlap with COSYSMO or COCOMO II models • Are current scale factors • Relevant • Sufficient • Are current scale factor values/range of values appropriate • How well do the various model variations track with respect to • Expert judgment • Actual experiences/projects
SOS Estimation Example Using Only Software Size as the Size DriverHazardous Materials ResponseSystem of Systems
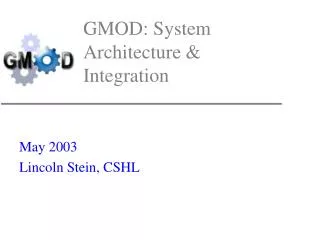
Hazardous Materials Response SOS Network Comms 800 eKSLOC Sensor Data Processing 500 eKSLOC HazMat Materials Identification 900 eKSLOC Command And Control 3000 eKSLOC System of System Architecture Example
SOS Integration Calculations with Nominal Level 1 and Level 0 Drivers Total SOS Integration Effort: ~9310 Person Months or 775.8 Person Years
Parametric Cost Model Critical Path Tasks and Status • Converge on preliminary cost drivers, WBS • Converge on detailed definitions and rating scales • Obtain initial exploratory dataset • Refine model based on data collection and analysis experience • Obtain IOC calibration dataset • Refine IOC model and tool
Upcoming Calendar of Events: 2004/2005 USC CSE Annual Research Review (Los Angeles, CA) COCOMO Forum (Los Angeles, CA) … J A S O N D J F M A M J 2004 2005 Practical Software & Systems Measurement Workshop (Keystone, CO) Proposed First Working Group Meeting
Next Steps • Refine the model based on delphi inputs and actual data • Working group meeting at October 2004 COCOMO II Workshop We would appreciate your help!
Questions or Comments? • Jo Ann Lane jalane@tns.net • Websites http://cse.usc.edu (COSOSIMO web site coming soon…) • Books • Boehm, B., et al, Software Cost Estimation with COCOMOII, 1st Ed, Prentice Hall, 2000 • Boehm, B., Software Engineering Economics, 1st Ed, Prentice Hall, 1981 • Articles • Boehm, B., et al., Future Trends, Implications in Cost Estimation Models, CrossTalk April 2000. • Gilligan, John M., Department of the Air Force, Military-Use Software: Challenges and Opportunities, CrossTalk, January 2004.